
User Guide
Port Box
Table of Contents
- 1. About
- 2. Equipment Required for Operation
- 3. Connecting the Test Assembly
- 4. Using UberSalt Diagnostic Software
- 5. SuperSALT Diagnostic Tests
- Interactive Diagnostic Utilities
- 7. Fatal System Errors
- 8. Error Report Analysis
List of Illustrations
- Figure 3-1. Enhanced CPS SuperSALT Diagnostic Software Splash Screen
- Figure 4-1. Main Menu
- Figure 4-3. Extend Unit Test
- Figure 4-5. Change Test Opts
- Figure 4-6. Show Test Group
- Figure 4-7. Error Summary
- Figure 5-1. 2-Way Clock Test
- Figure 5-2. 6502 Test
- Figure 5-3. ANTIC Stress Test
- Figure 5-4. Bar Test
- Figure 5-5. Color Bars
- Figure 5-6. GTIA Diagnostics Phase 1
- Figure 5-7. GTIA Diagnostics Phase 2
- Figure 5-8. GTIA Diagnostics Phase 3
- Figure 5-9. Atari 400/800 Voltage Test
- Figure 5-10. Atari 1200XL Voltage Test
- Figure 5-11. Atari XL/XE Voltage Test
- Figure 5-12. I/O Test Progress
- Figure 5-13. Atari 400/800 OS ROM Checksum
- Figure 5-14. RAM Test Screen
- Figure 5-15. RAM Test Summary Showing a Failure
- Figure 5-16. Tone Test
- Figure 5-17. Video Test
- Figure 5-18. Xternal Audio Test
- Figure 6-1. Joystick Test
- Figure 6-2. Keyboard Test
- Figure 6-3. Paddle Test
- Figure 7-1. Fatal System Error Screen
- Figure 8-1. Error Summary – System
- Figure 8-2. Error Summary – 6502
- Figure 8-3. Error Summary – OS ROM Checksum
- Figure 8-4. Error Summary – RAM Test
- Figure 8-5. Error Summary – GTIA Exercise Showing Error
- Figure 8-6. Error Summary – PIA Exercise
- Figure 8-7. POKEY Exercise
- Figure 8-8. Timers/Random Number Generation
- Figure 8-9. Error Summary – Baud Rate
List of Tables
- Table 5-1. Voltage Test Limits
- Table 7-1. Fatal System Errors
- Table 8-1. PIA Port Loop-back Configuration
- Table 8-2. SYNC 19.2K Error Bit Assignments
- Table 8-3. ASYNC Baud Rate Bit Assignments
1. About
UberSALT is an extensively enhanced Atari 8-bit diagnostic cartridge based on CPS SuperSALT Rev. A and designed for use with the CPS SuperSALT Diagnostic Test Assembly. It provides interactive and unattended diagnostic testing with expanded test coverage, improved test control and reporting, automatic diagnostic-hardware detection, and comprehensive error tracking.
This guide describes the installation and operation of the 8YoRetro Port Box when used with the Atari CPS SuperSALT diagnostic software. It covers connecting the CPS SuperSALT Test Assembly (also referred to as the “test assembly” or “port box”), configuring the hardware, running the diagnostic tests, and interpreting their results.
The port box is an external hardware interface used by the CPS SuperSALT diagnostic software to exercise the external interfaces of an Atari 8-bit computer. Installed between the console and associated test cables, it provides the hardware resources required for the software to generate, route, and monitor signals, allowing comprehensive verification of the system’s external I/O functionality. It allows the diagnostic software to actively drive and measure signals that would otherwise require external test equipment.
Scope
This guide assumes the port box is fully assembled, calibrated and verified and focuses on its practical operation. For detailed information about calibration, design and operation of the test assembly, refer to the Port Box Technical Reference Manual.
Compatibility
The 8YoRetro Port Box is fully compatible with Atari’s original CPS SuperSALT diagnostic software and, when used with that software, behaves like the original Atari test assembly.
An enhanced version of the diagnostic software is available to support additional capabilities. This software is fully compatible with both the original Atari CPS SuperSALT Test Assembly and the 8YoRetro Port Box, including test assemblies equipped with the optional 8YoRetro Error Display Board.
Additional features provided by the enhanced software include:
- Automatic detection of the Port Box and Error Display Board during startup
- Support for the 8YoRetro Error Display Board
- The Port Box Hi-Z operating mode, which prevents conflicts with the 2-Way Clock test
Unless otherwise noted, the procedures and screen images in this manual assume the enhanced diagnostic software is being used.
2. Equipment Required for Operation
These are the items you will need to put the Port Box to use.
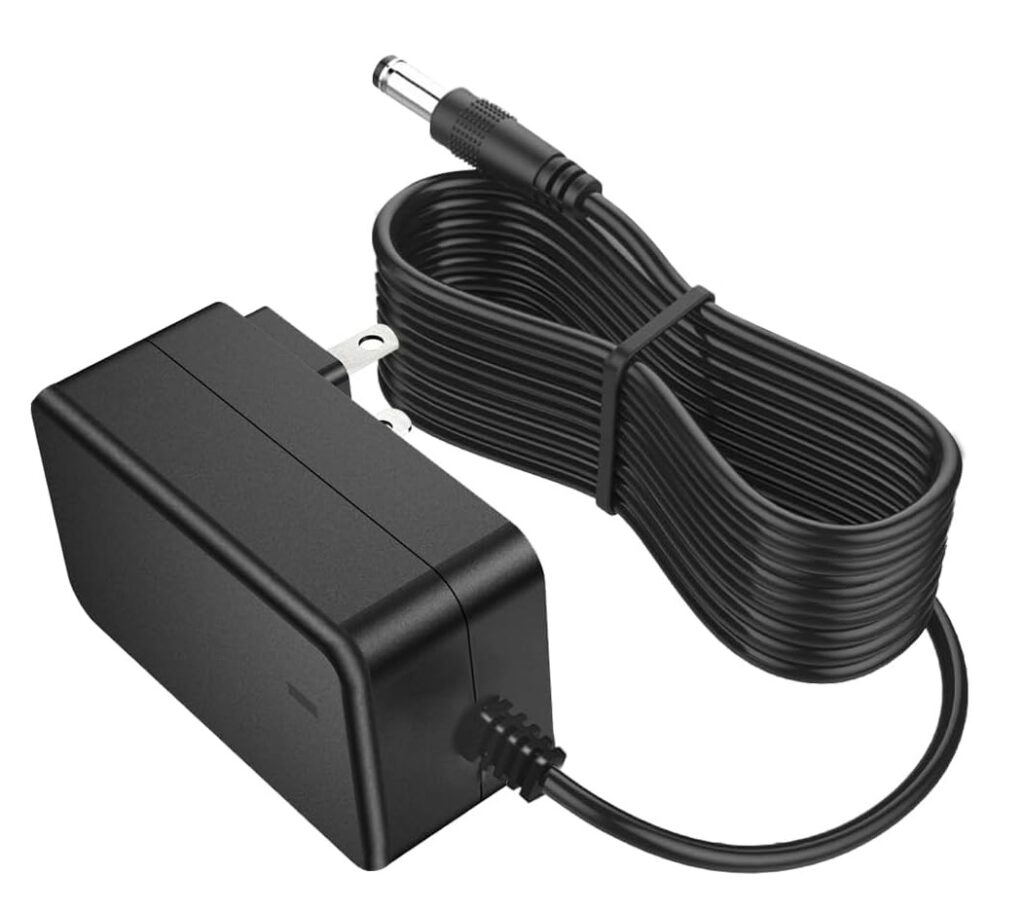
Power Adapter
Source a power adapter with the following specifications:
- 12 volts DC output.
- 24 watts minimum (2.0 Amps, aka: 2000mA).
- 5.5mm x 2.1mm, center-positive barrel connector.
- Appropriate input voltage for your particular region.
- Cable length suitable for your specific needs.
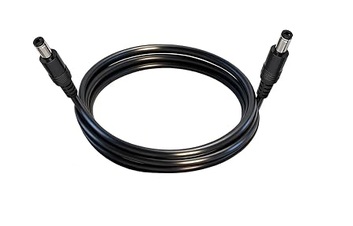
Pass Thru Cable
The pass-thru cable is used to loop the 400/800 console power supply through the Port Box for A/C current monitoring.
5.5mm x 2.5mm male-to-male barrel connector cable, 3ft ~ 6ft long.
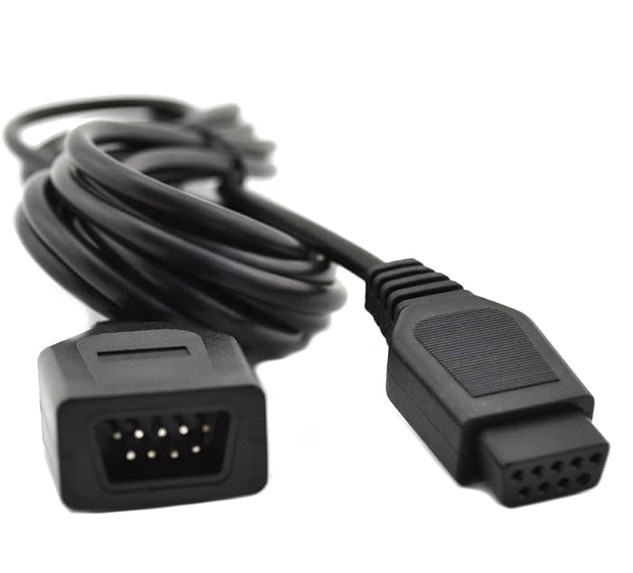
Controller Port Jumper Cables
Four 9-conductor female-female DE-9 controller port jumper cables are required to connect the Port Box to a console’s controller jacks for diagnostic testing. Atari had supplied these with their original device, but they are virtually unobtainable today. The most practical alternative is to combine the following readily available items.
Controller Port Extension cables
Four individual extension cables (often sold in pairs).
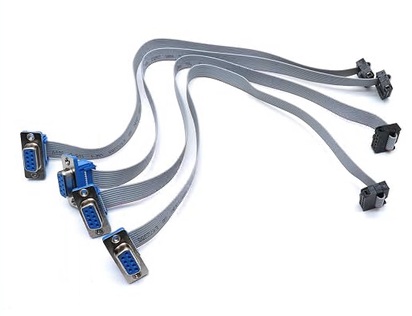
DE-9 Ribbon Cables
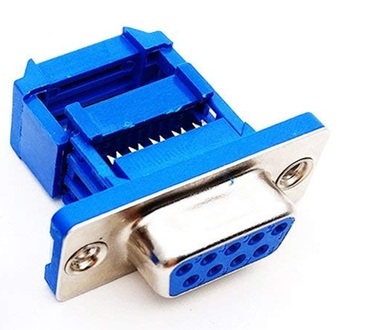
Four individual DE-9 female to 2×5 (10-pin) IDC header cables.
Hybrid Cable Option
Optionally, DE-9 crimp connectors can be added to the aforementioned IDC header to female DE-9 IDC cables to create a hybrid IDC-header and gender-changer cable.
Four individual Female DE-9 IDC crimp connectors.

SIO Cable
A 13-conductor SIO cable is required to connect the Port Box to a console for testing. These are still fairly common on the second-hand market if you don’t already have one.
3. Connecting the Test Assembly
Perform the following steps exactly as described below to connect the test assembly.
- Using 9-conductor controller cables, connect the corresponding controller ports between the console and the test assembly as follows:
- Console controller port 1 to test assembly port 1
- Console controller port 2 to test assembly port 2
- Console controller port 3 to test assembly port 3 (if equipped)
- Console controller port 4 to test assembly port 4 (if equipped)
- Connect the test assembly to the console serial port using a 13-conductor SIO cable.
- Connect the power adapter to the console:
- 400/800/1200XL:
- Insert the barrel connector from the console power adapter to the A/C power pass-thru jack on the test assembly.
- Insert one end of the A/C pass-thru jumper cable into the other A/C pass-thru jack on the test assembly.
- Insert the other end of the A/C pass-thru jumper cable into the console’s power input jack.
- All other models:
- Connect the power adapter directly to the console as described in the Atari owner’s manual.
- 400/800/1200XL:
- Set the tone switch to the setting appropriate for the UUT. 400/800 vs XL/XE.
- Connect the display/television cable as per the Atari owner’s manual.
- Insert the SuperSALT diagnostic software cartridge.
- Set the console power on – the splash screen should appear on the display (See figure 3-1).
Figure 3-1. Enhanced CPS SuperSALT Diagnostic Software Splash Screen
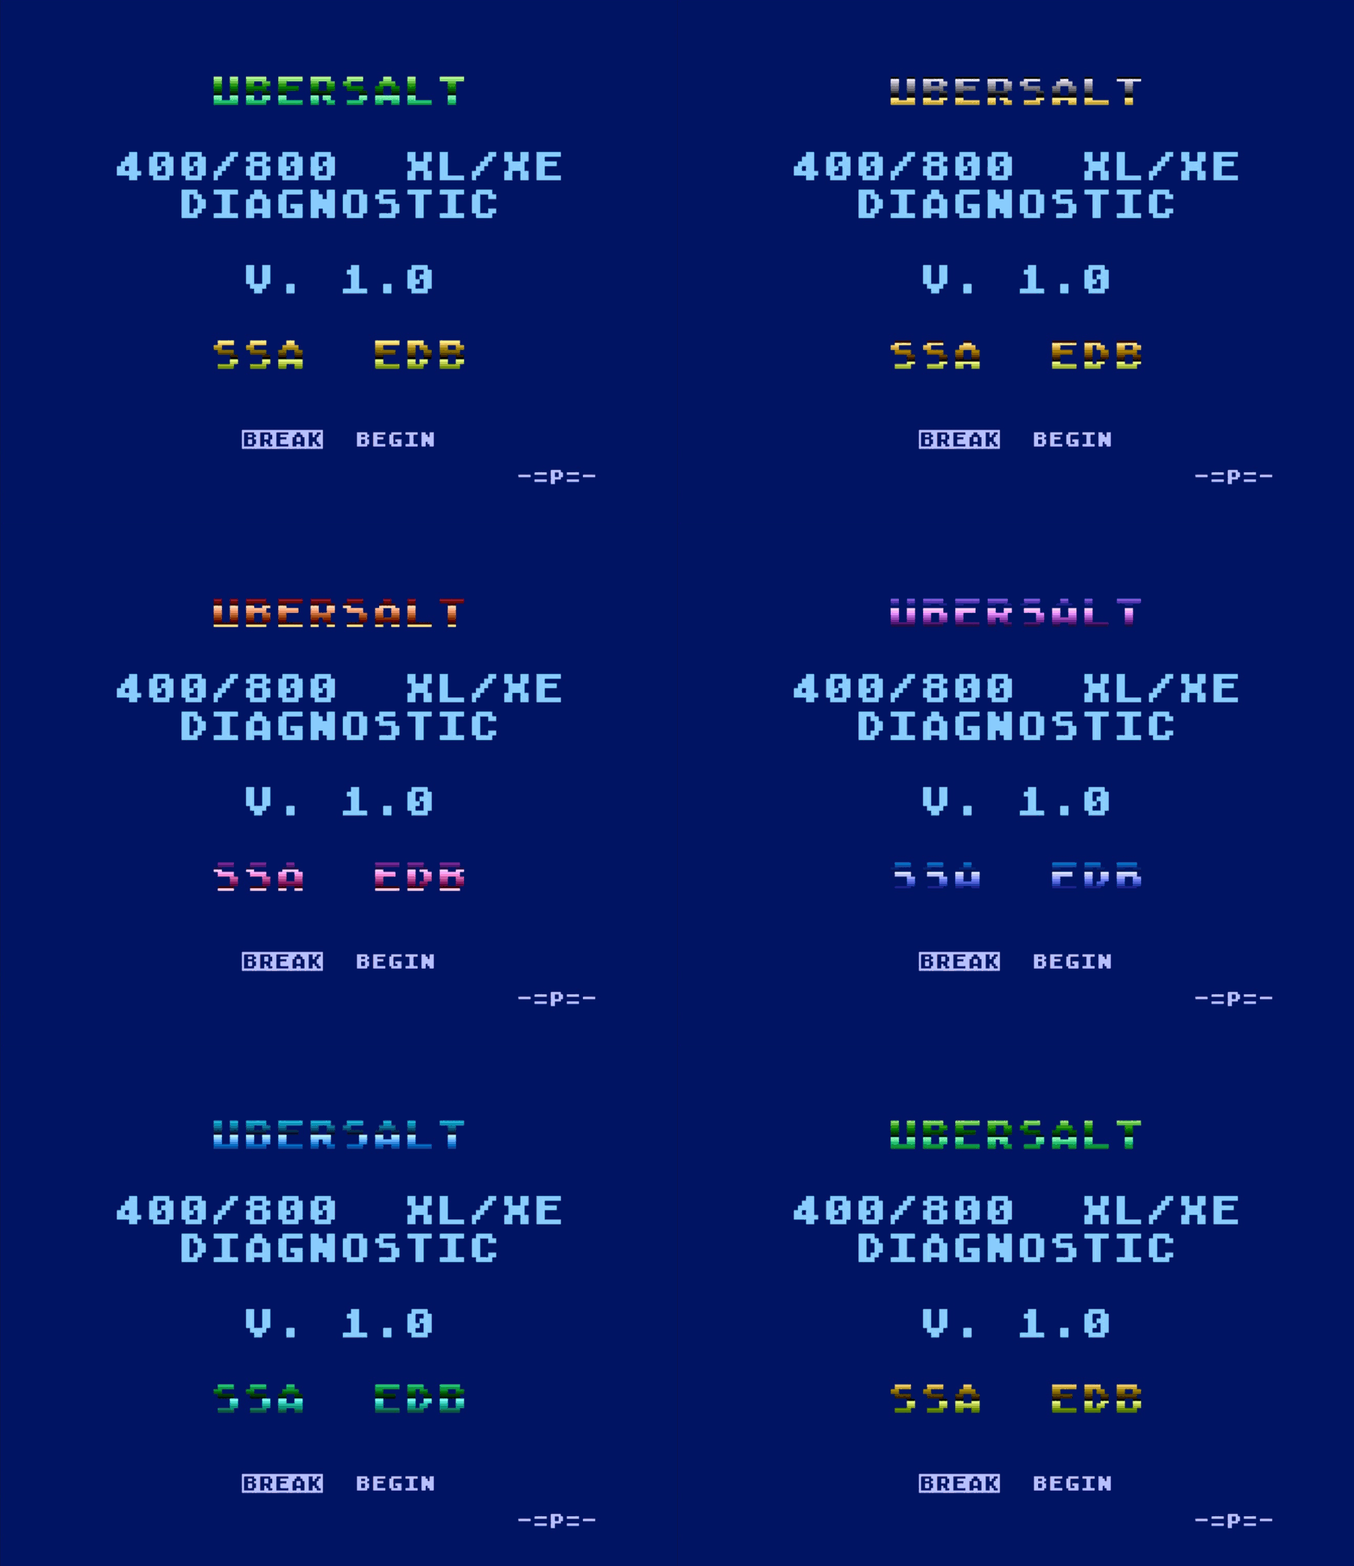
During startup, the splash screen indicates the presence of supported hardware:
- SSA — SuperSALT Assembly
- EDB — Error Display Board
When hardware is present, these indicators cycle through the Atari color palette. If no indicators are shown, no test assembly or Error Display Board has been detected.
Note: If the test assembly is connected but not detected, verify all cable connections, ensure input power is present, and confirm the power switch is on. Press RESET to reinitialize the diagnostic software; the test assembly will be re-detected and the splash screen updated accordingly.
Only the enhanced CPS SuperSALT diagnostic software supports test assembly detection. The original software does not perform this detection and assumes the test assembly is present.
4. Using UberSalt Diagnostic Software
The diagnostic software contained in UberSalt is designed to exercise and detect failures in all areas of the system, including CPU, RAM, ROM, SIO port, controller ports, ANTIC, GTIA, POKEY and keyboard, as well as video and audio logic.
The software provides three distinct test facilities, a sub menu where test parameters can be customized, and an error summary report. These are all accessible from the Main Menu.
Software Requirements
UberSALT requires 16 KB of contiguous base RAM ($0000-$3FFF). Additional installed RAM is detected and tested but is not required for operation.
Main Menu
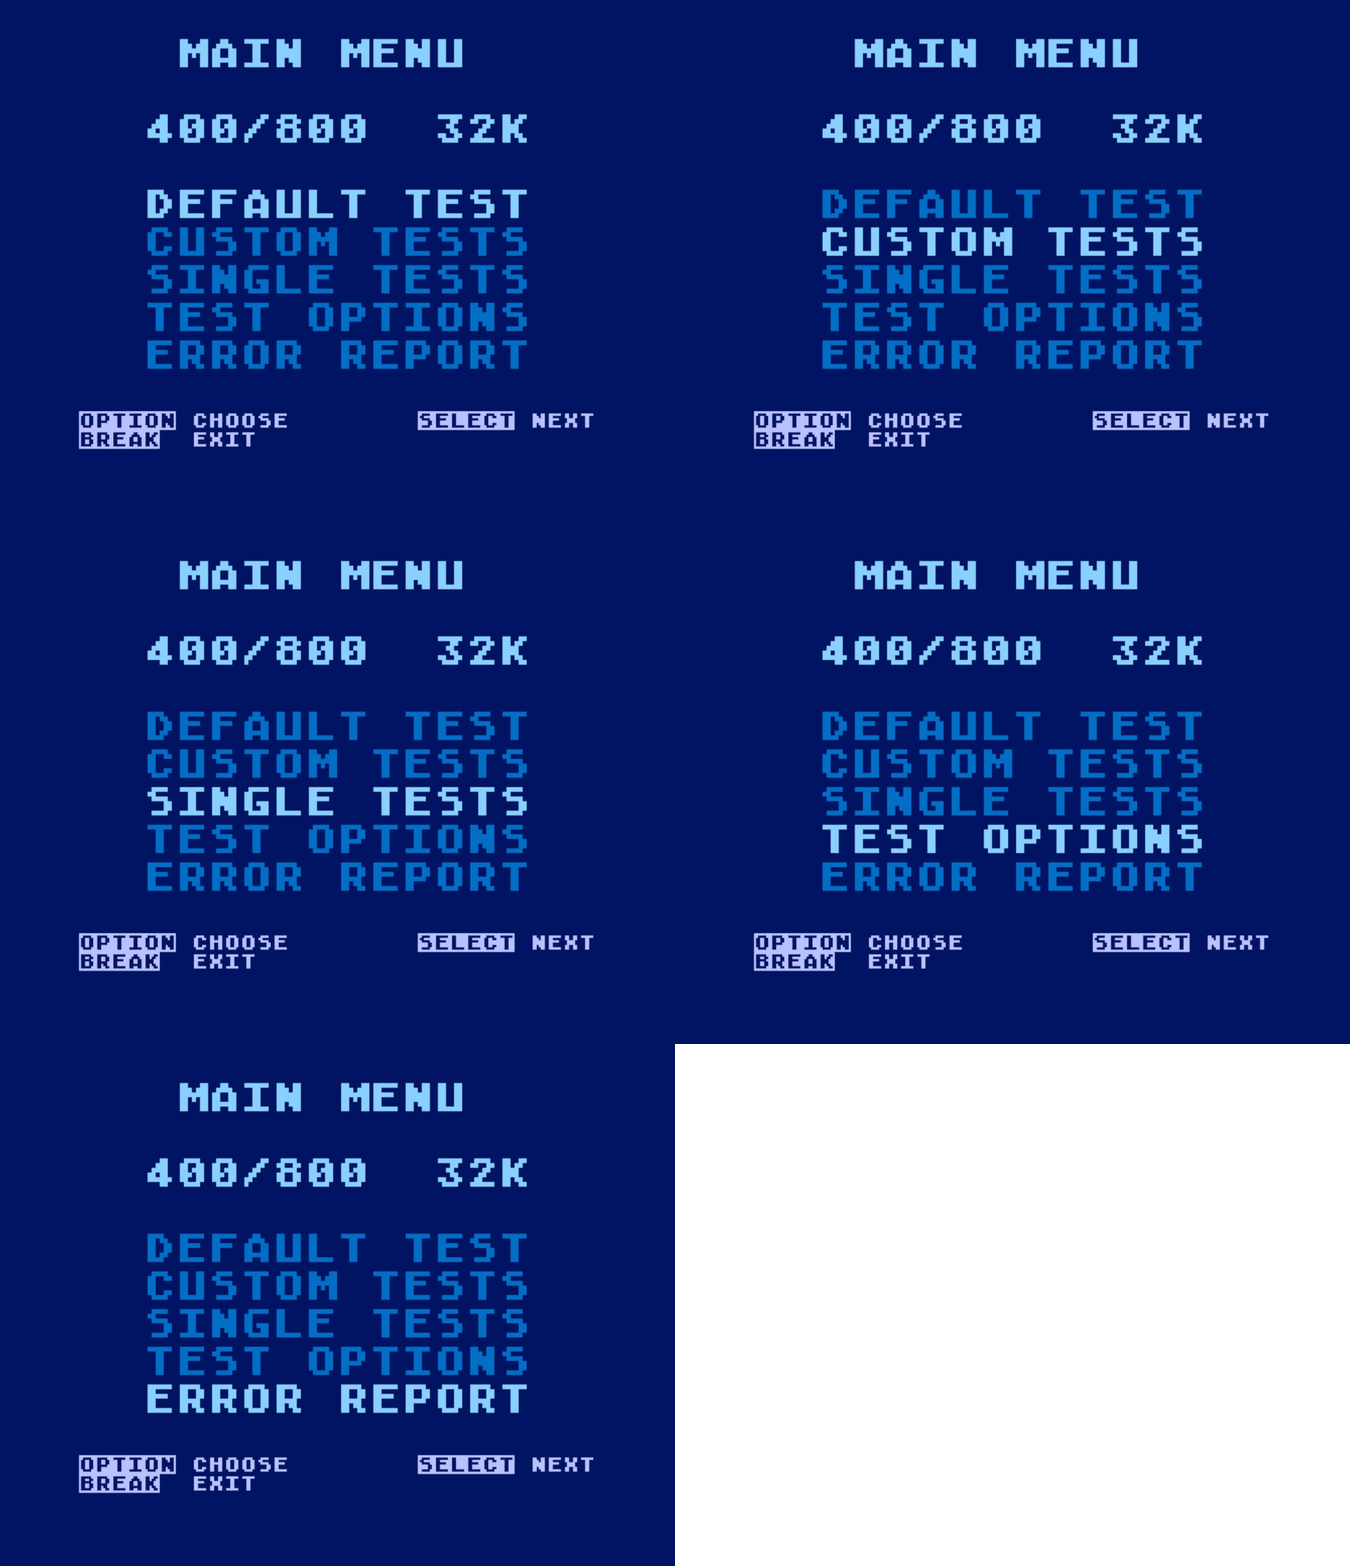
The Main Menu lies at the topmost navigation level. It provides access to the five primary diagnostic tools offered by the diagnostic software.
As shown in figure 4-1, the Main Menu also displays console information, along with on-screen prompts identifying the keys used to navigate the menu.
Figure 4-1. Main Menu
Menu Navigation
Use OPTION to execute the highlighted menu item, SELECT to move the cursor to the next item, and BREAK to return to the previous menu.
The Individual Tests, Change Test Opts, and Show Err Summary menus use different execution controls than the other test menus. Always refer to the instructions displayed at the bottom of the screen before proceeding.
During testing, pressing BREAK returns to the previous menu. Some tests must complete before the software responds to the BREAK key, so a brief delay is normal.
Default Test
This is the default selection when UberSalt starts and serves as the recommended starting point when evaluating a system of unknown condition. It executes a predefined sequence of tests designed to identify hardware faults in the console. The tests are listed on the screen and performed in the order displayed.
Custom Test
This function executes a sequence of tests (see figure 4-3) that can be customized using the Test Options menu. It is particularly useful for repeatedly exercising selected system functions when investigating intermittent faults.
Figure 4-3. Extend Unit Test
This menu is static and does not reflect the current settings established through Test Options. Nevertheless, the diagnostic tests execute according to the active test configuration.
Individual Tests
This menu provides direct access to individual tests, allowing each test to be selected and executed with a single keystroke (see figure 4-4). All tests operate according to the parameters configured in the Test Options menu.
Test Options
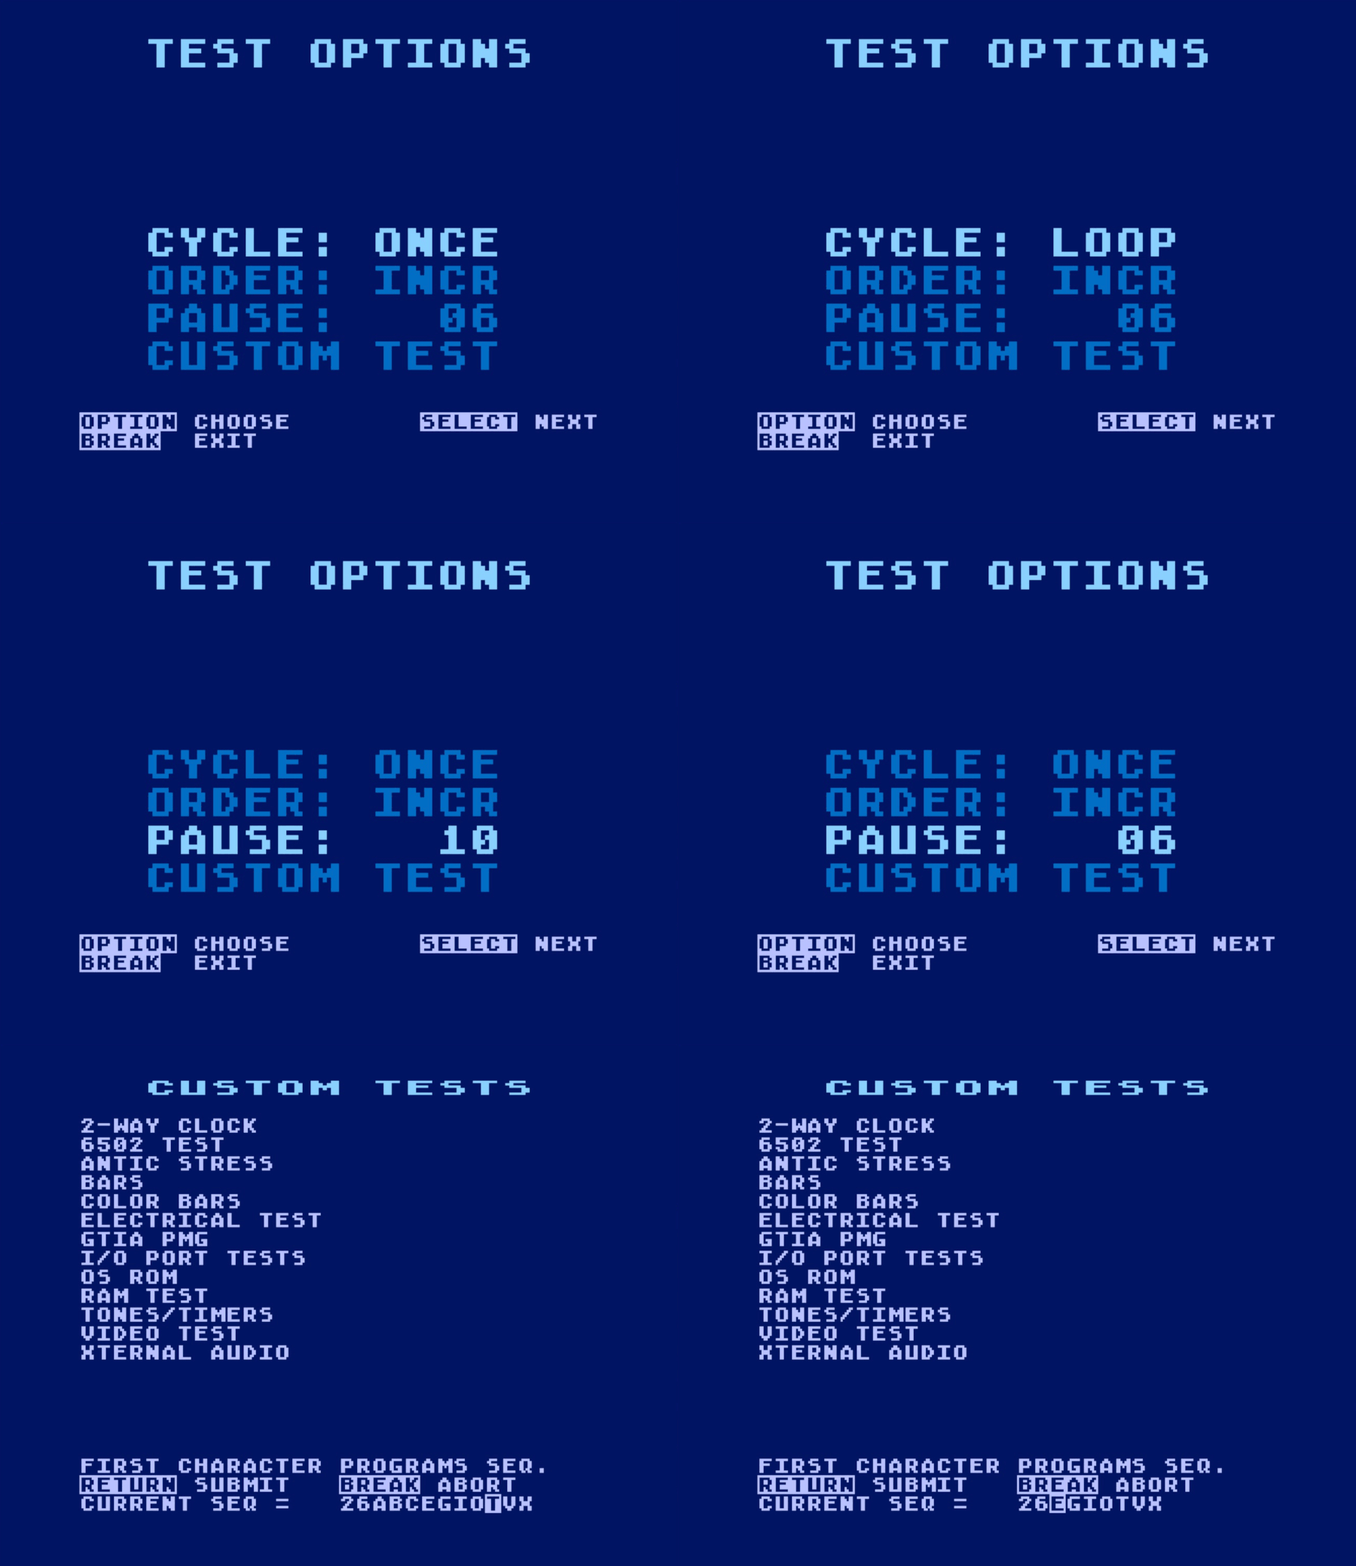
This menu provides additional control over the diagnostic test parameters (see figure 4-5). It is most commonly used with the Custom Test to tailor individual tests or test sequences for troubleshooting, targeted functional verification, or long-duration burn-in testing.
Figure 4-5. Change Test Opts
Option: Test
Applies to: Extend Test • Performance Test • Individual Test
SNGL PASS | Terminates after one complete test cycle |
CONTINUOUS | Repeats continuously until interrupted |
Option: Sequence
Applies to: Extend Test
INCR | Runs tests in the defined order |
RANDOM | Shuffles the test order before each cycle and repeats until interrupted |
Option: Disp Time
Applies to: Extend Test • Performance Test • Individual Test
02–14 | Delay (in seconds) after each test |
RTN | Requires user input to continue at certain points |
Option: Show Test Group
Applies to: Extend Test
This utility is used to define a custom test sequence (see figure 4-6) for the Extend Unit Test. A test group (also referred to as a test sequence) specifies both which tests are executed and the order in which they are executed.
Figure 4-6. Show Test Group
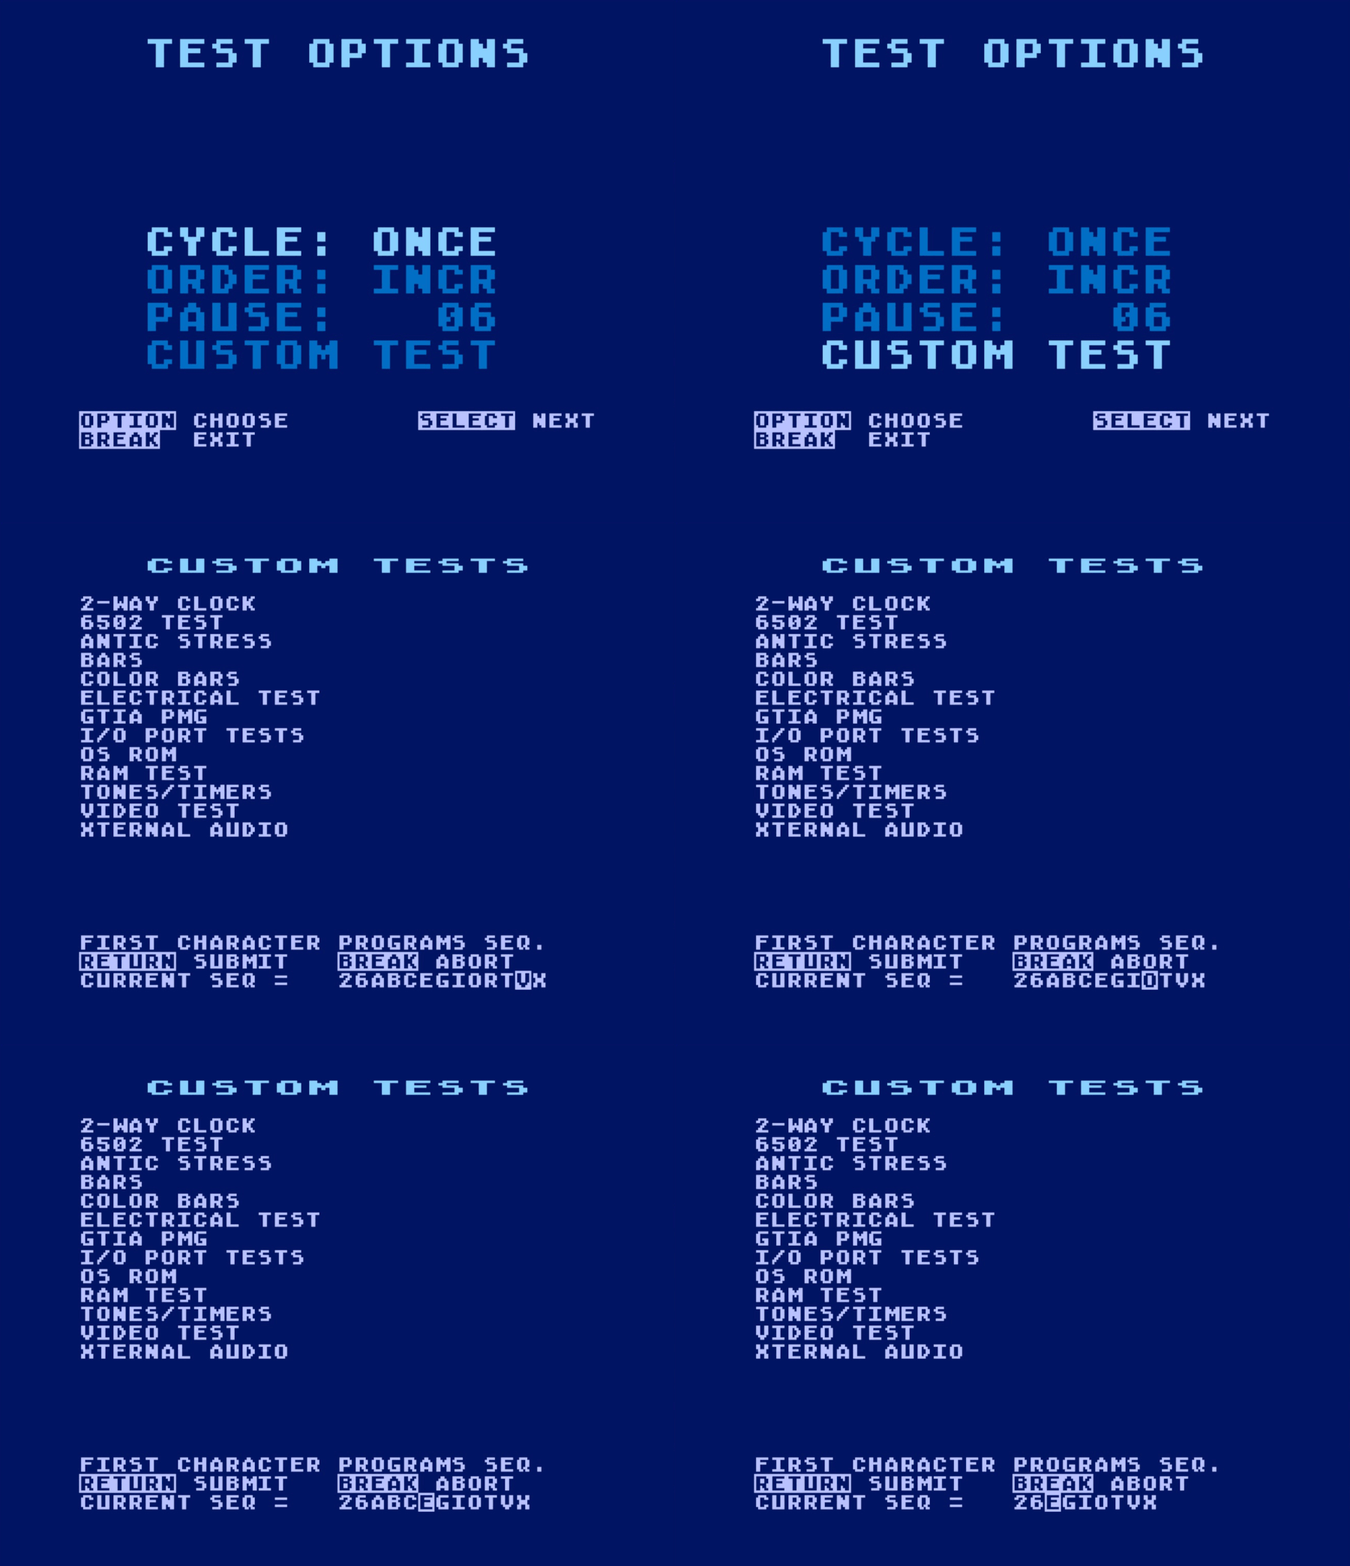
The upper portion of the screen displays a list of available tests, each identified by a unique character shown as the first character of each entry. The current test sequence is shown near the bottom of the screen beside CURRENT SEQ as a string of these characters (for example, 26ABCGIORTVX), with each character corresponding to a test in the list.
To define or modify the sequence, enter the desired string of characters at the CURRENT SEQ prompt. The prompt accepts a valid test sequence character, or the following input:
| DELETE | Removes the sequence character to the left of the cursor |
| RETURN | Accepts the sequence and returns to the previous menu. Submitting a blank entry sets the sequence to its default: 26ABCGIORTVX |
| BREAK | Discards changes and returns to the previous menu |
Notes:
- The test sequence prompt provides only basic editing capability. Removing a test from the sequence may require deleting multiple characters and re-entering the remaining sequence.
- Twelve unique tests are available, but the test sequence prompt allows up to fourteen entries. Duplicate entries are permitted. The Error Summary counts each complete run of the test sequence as a single cycle, regardless of how many tests it contains; therefore, including duplicate entries may produce misleading statistical results.
- Unless the
SEQUENCE optionis set toRANDOM, the Extend Unit Test executes the test sequence from left to right. - Entering the Performance Test resets the
SEQUENCEoption to its defaultINCRsetting, and the Test Group to its default (26ABCGIORTVX). - Submitting a null sequence reverts Test Group to its default (
26ABCGIORTVX).
Show Err Summary
The Show Err Summary function displays the accumulated results of the diagnostic tests performed by the CPS SuperSALT software. The Error Summary consists of nine pages that can be viewed sequentially by pressing the RETURN key. Figure 4-7 shows the complete Error Summary report.
This section provides a brief overview of the Error Summary report. For a detailed explanation of each summary page and guidance on interpreting diagnostic results, refer to section 8, Error Report Analysis.
Figure 4-7. Error Summary
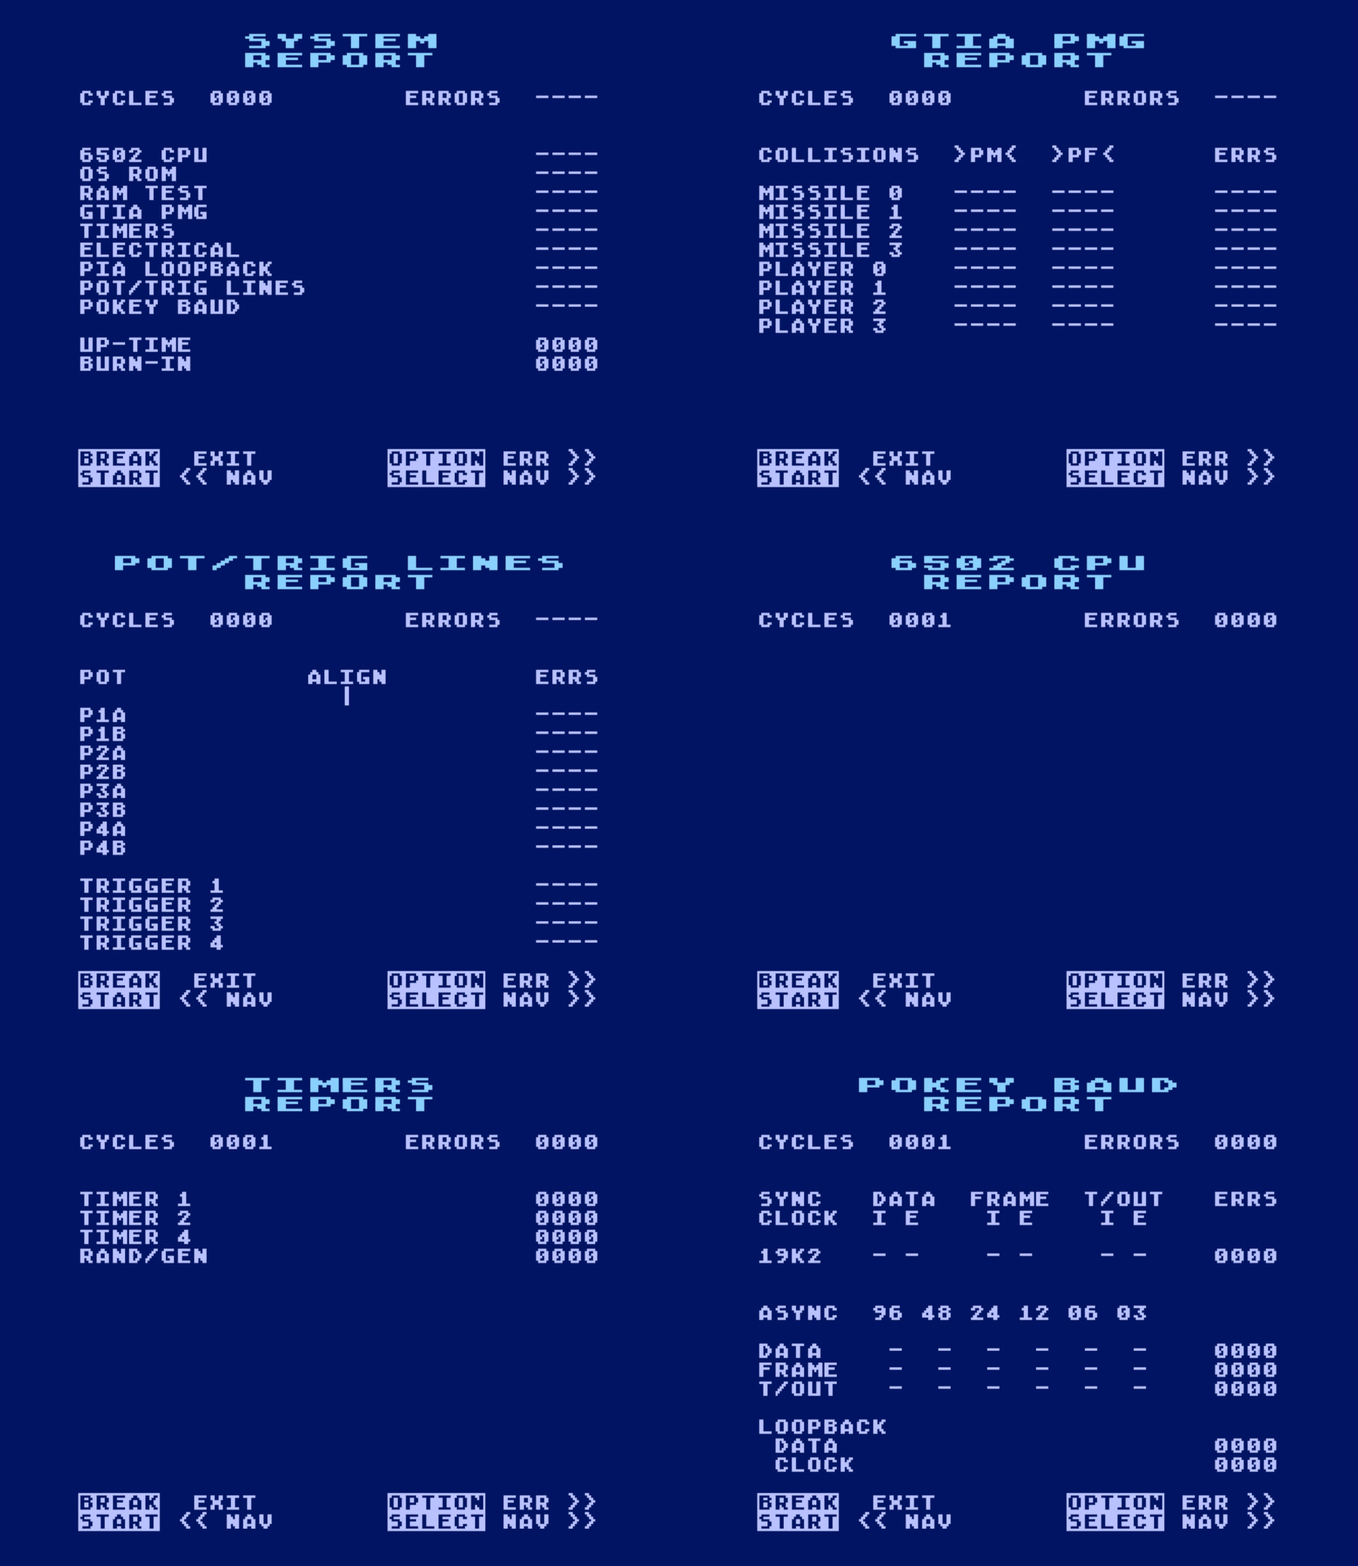
Important: Do not use RESET to return to the Executive Menu if cumulative error data is to be preserved, as pressing RESET reinitializes the diagnostic software and clears all error summary data.
Note: The following tests are not represented in the Error Summary. Their results must be verified by the operator while the test is in progress.
- I/O Voltage Test
- ANTIC Stress Test
- 2-Way Clock Test
- Xternal Audio Test
- Bar Test
- Color Bars Test
- Tone Test
- Video Test
Note: The following diagnostic utilities require direct operator interaction and not represented in the Error Summary.
- Keyboard
- Joystick
- Paddle
- Maintenance Mode
5. SuperSALT Diagnostic Tests
This section describes each SuperSALT diagnostic test, including its purpose, operation, and any special requirements or observations needed to interpret the results. Where applicable, the test’s relationship to the automated test sequences and Error Summary is also discussed.
2-Way Clock Test
The 2-Way Clock test verifies operation of the serial port’s bidirectional clock line, referred to by the diagnostic software as the 2-Way Clock. The POKEY I.C. outputs a short 8-note melody on this line, which the port box routes to the console serial port’s audio input. As indicated in figure 5-1, hearing the melody through the A/V monitor or TV confirms that the console is capable of driving the 2-Way Clock line.
Figure 5-1. 2-Way Clock Test
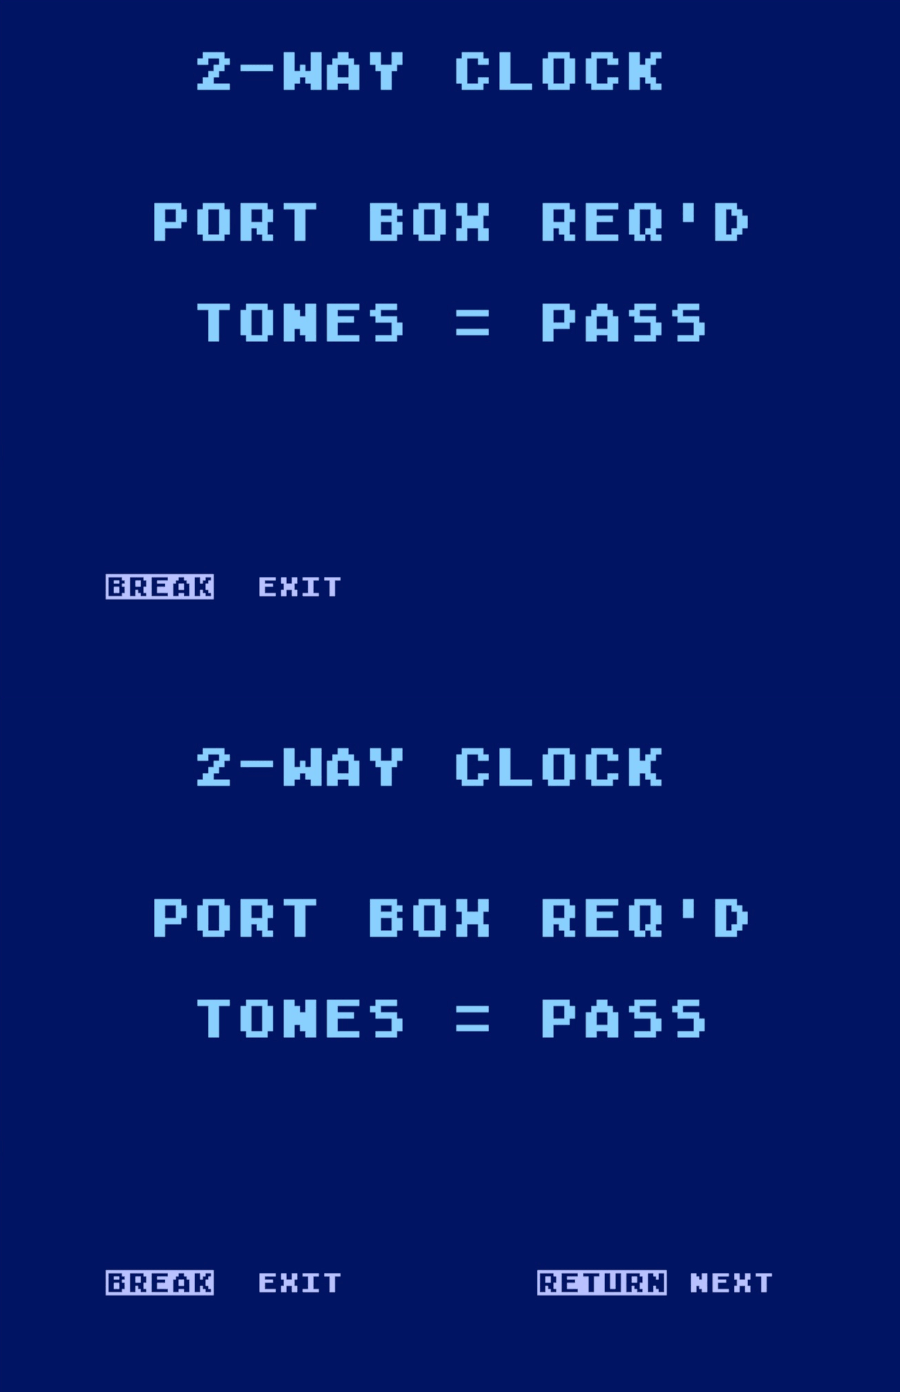
Troubleshooting: If the melody is faint or not heard, verify the port box tone switch position, all port box and A/V cable connections, and the TV/monitor volume before troubleshooting the console. These conditions are the most common causes of this symptom.
6502 Test
The 6502 Test verifies CPU operation by executing all 151 operation codes. Each cycle represents one complete execution of the instruction set, and each test pass consists of 100 cycles. Figure 5-2 shows the accumulated cycle and error counts displayed after each completed test pass.
Figure 5-2. 6502 Test
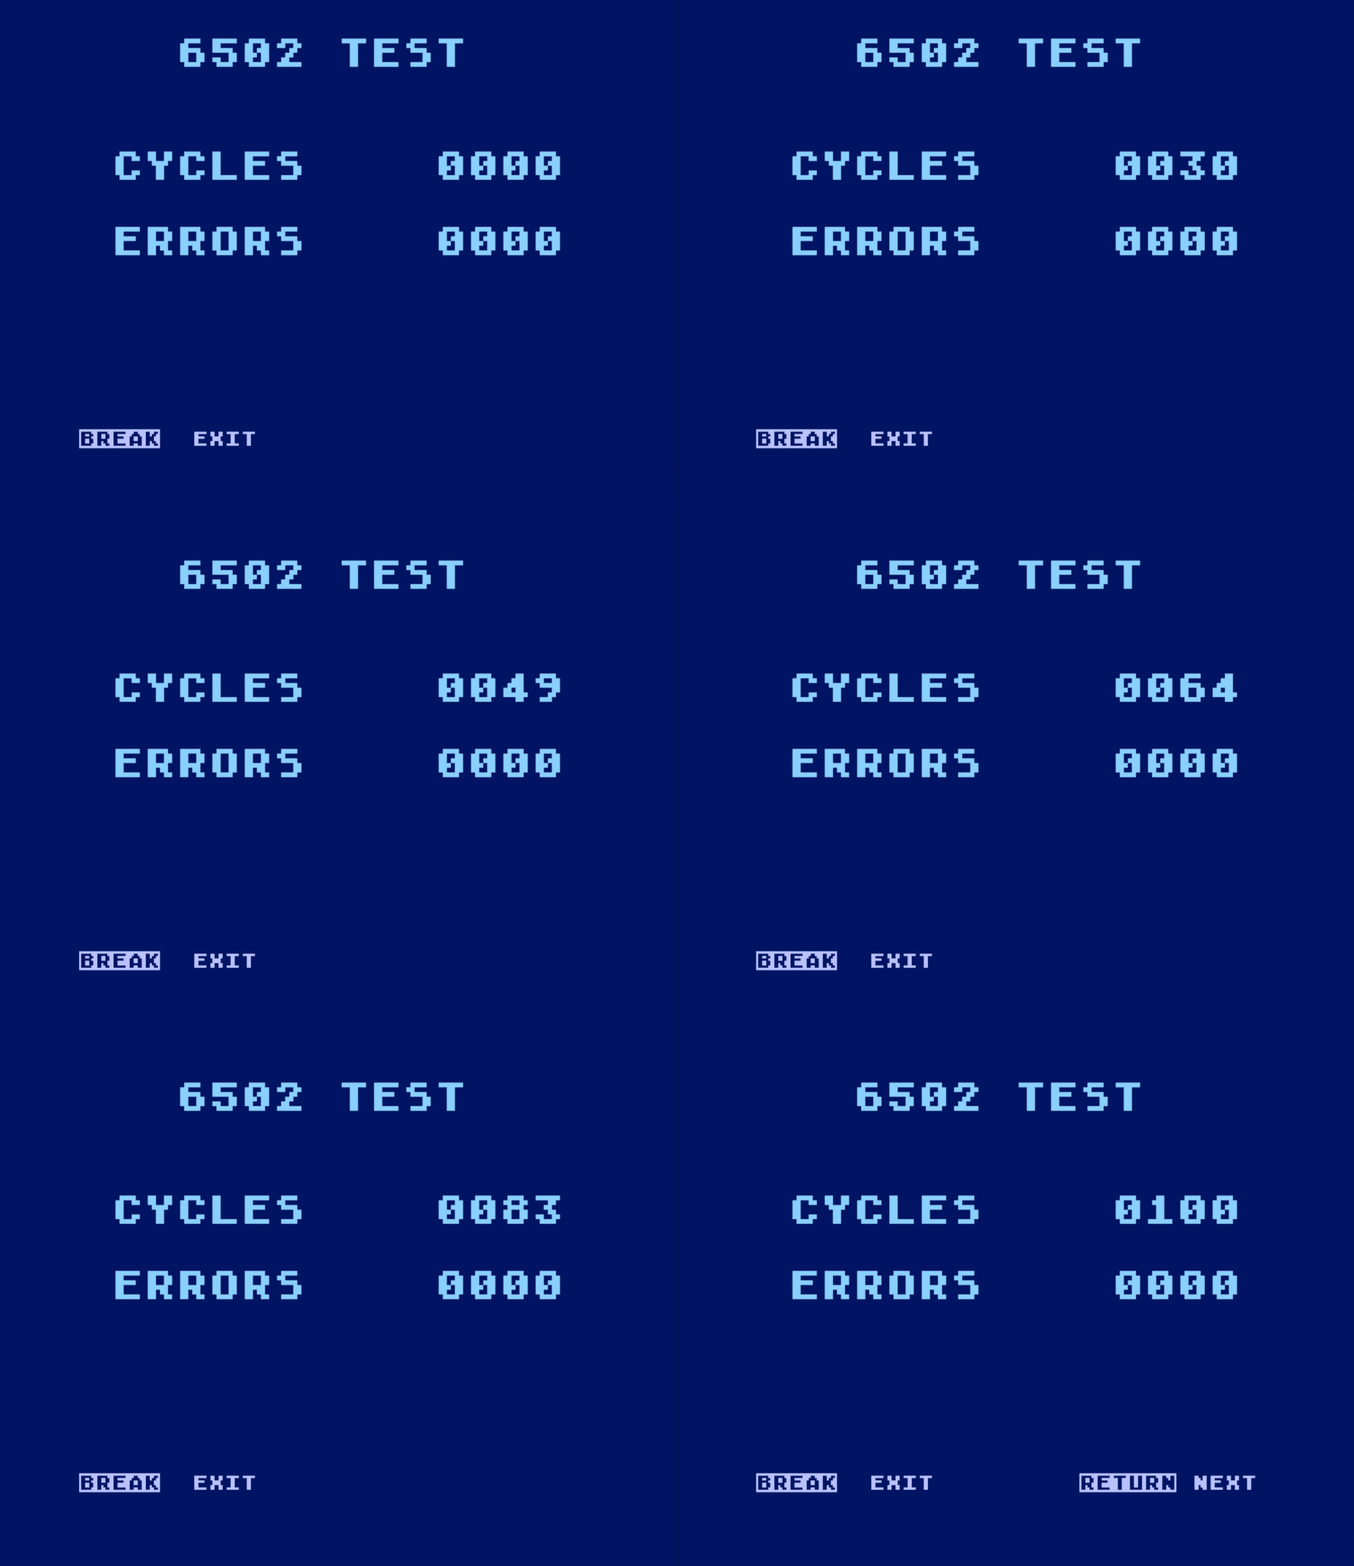
Troubleshooting: A detected error may result from faulty low-memory RAM rather than the CPU. Run the RAM Test to verify memory operation before replacing the 6502. A severe CPU or related hardware fault may prevent the test from completing and cause the console to lock up.
ANTIC Stress Test
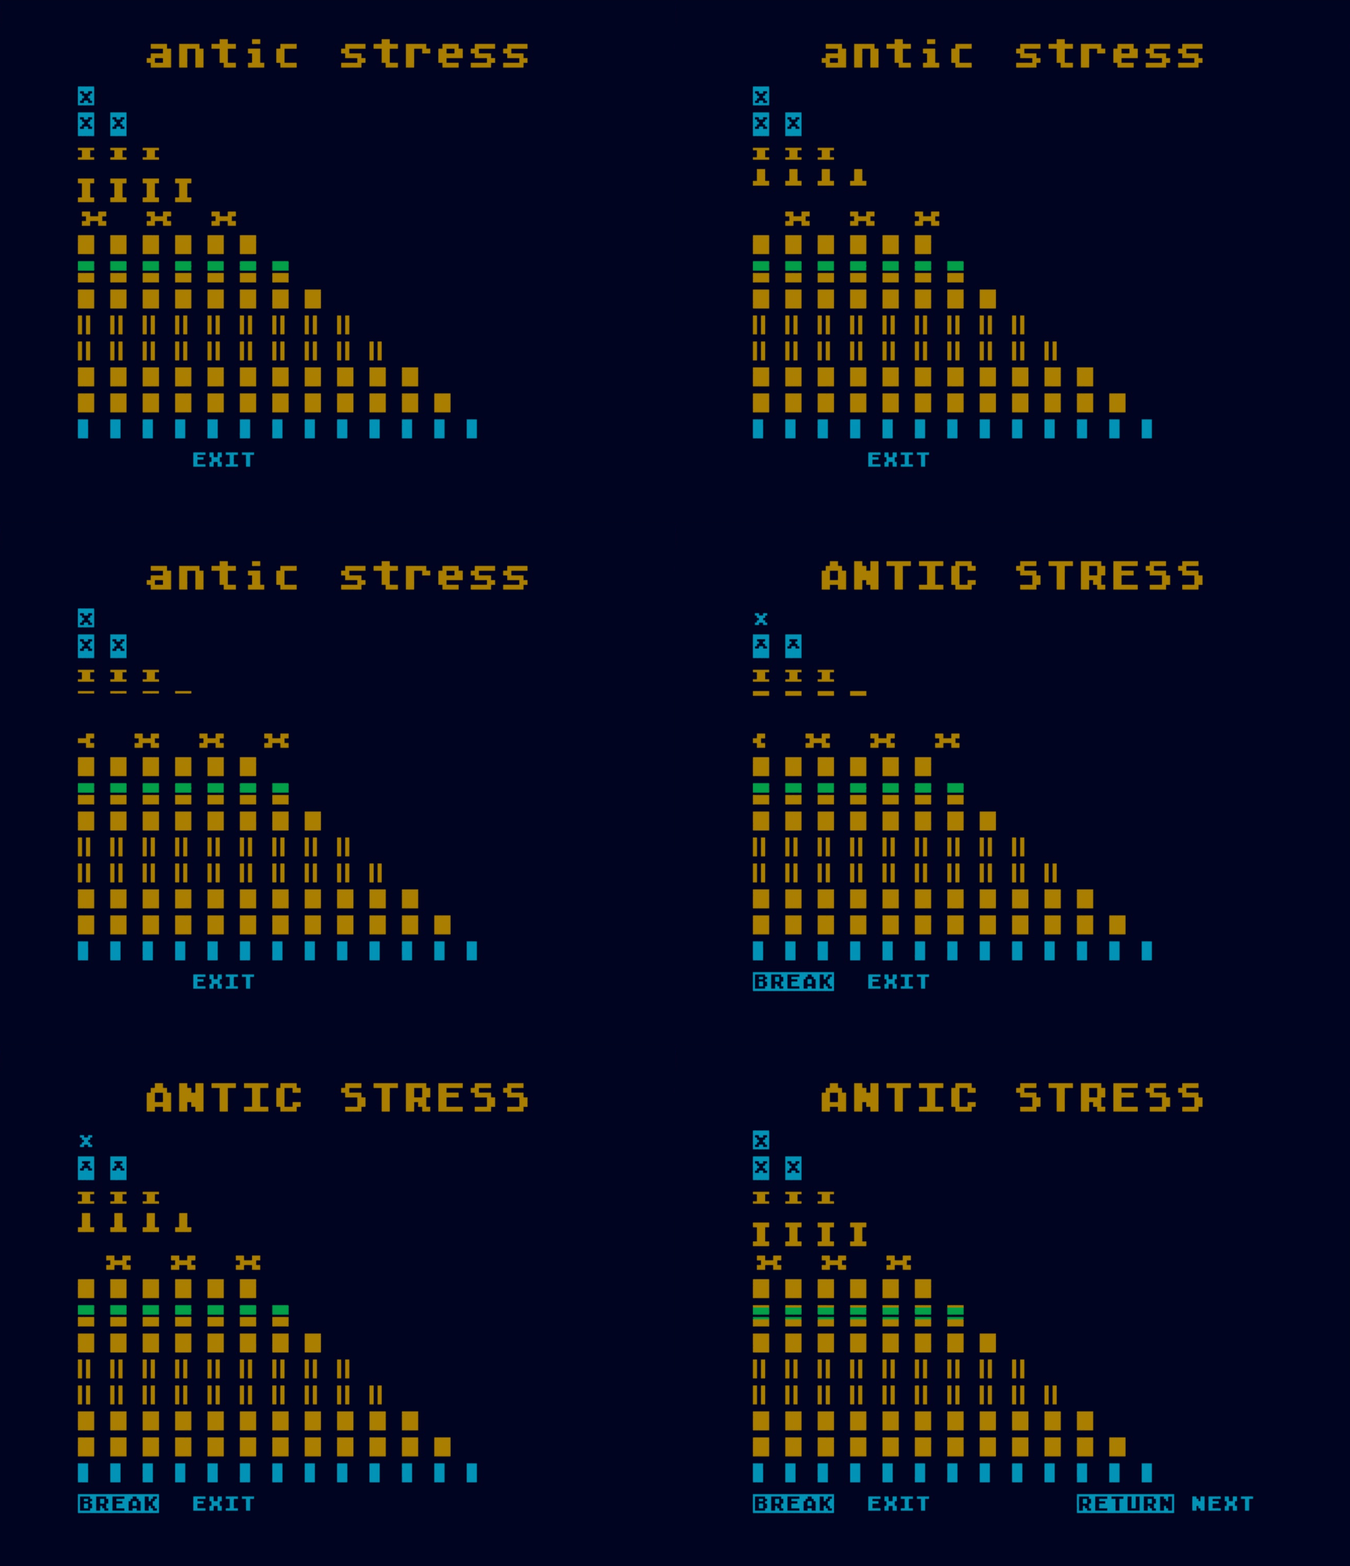
The ANTIC Stress Test verifies operation of the ANTIC I.C. by exercising the full range of ANTIC display modes. As shown in the animated display in figure 5-3, the operator determines whether the test passes by confirming that the display behaves as shown. Color is not significant; only the correct appearance and operation of each display element is required.
Figure 5-3. ANTIC Stress Test
Bar Test
The Bar Test verifies that the GTIA I.C. is correctly generating the four luminance (LUM0-LUM3) bits by displaying an eight-step grayscale pattern. As shown in figure 5-4, the display consists of eight uniformly shaded horizontal bars progressing from black to white, with a thin white line immediately above the top bar. The operator determines whether the test passes by confirming that the display matches the figure.
Figure 5-4. Bar Test

Troubleshooting: Observe the display for at least 10 seconds to ensure that the bars remain steady and free of color. Missing bars, repeated or uneven shades, colored bars, or a display that shifts or flashes indicate a problem with the GTIA I.C. or its associated circuitry.
Color Bars
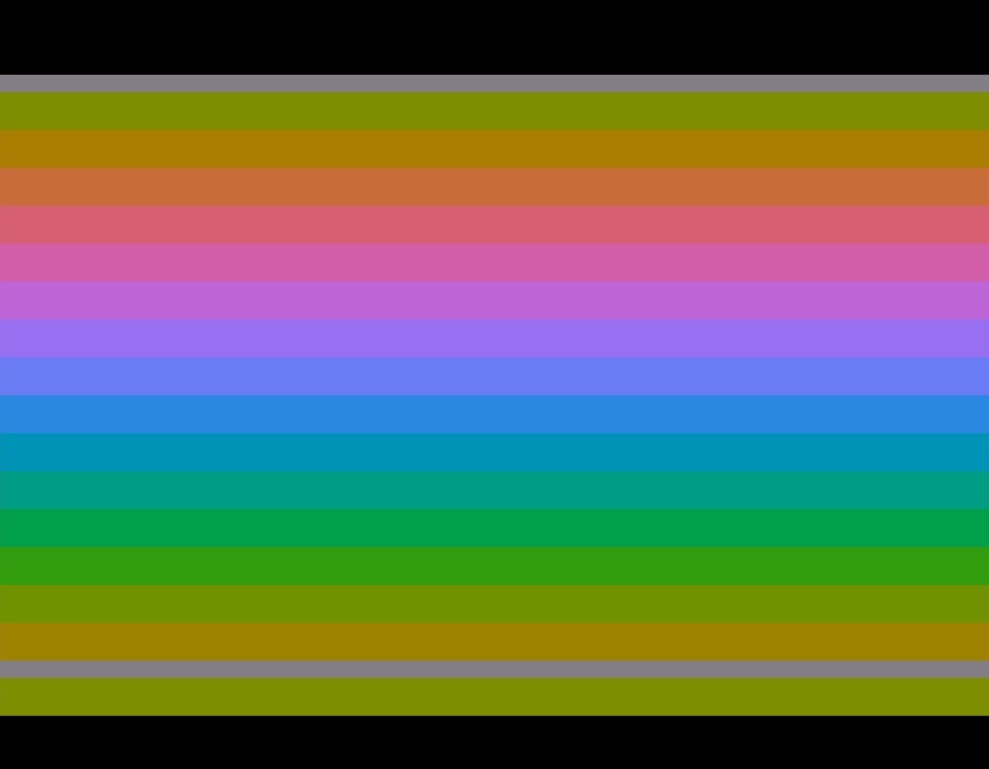
The Color Test verifies operation of the GTIA I.C.’s color generation circuitry and provides a means of adjusting the console’s color frequency. As shown in figure 5-5, the display consists of a 15-color rainbow scale separated from a single reference color bar by a gray reference bar. The operator determines whether the test passes by confirming that the upper and lower reference color bars are identical.
Figure 5-5. Color Bars
Color Verification and Adjustment
- Allow the console to warm up for at least 15 minutes.
- Compare the color bar immediately above the gray reference bar with the single color bar below it.
- If necessary, adjust the GTIA color potentiometer until the two bars are identical.
- Verify that each color bar is uniform across its entire width. Minor edge glitches are acceptable.
Troubleshooting: If the colors cannot be matched or the display contains missing bars or little to no color, verify the color adjustment before suspecting a faulty GTIA or ANTIC I.C. An incorrect or defective color crystal (Y1) may also produce incorrect colors.
GTIA Diagnostics
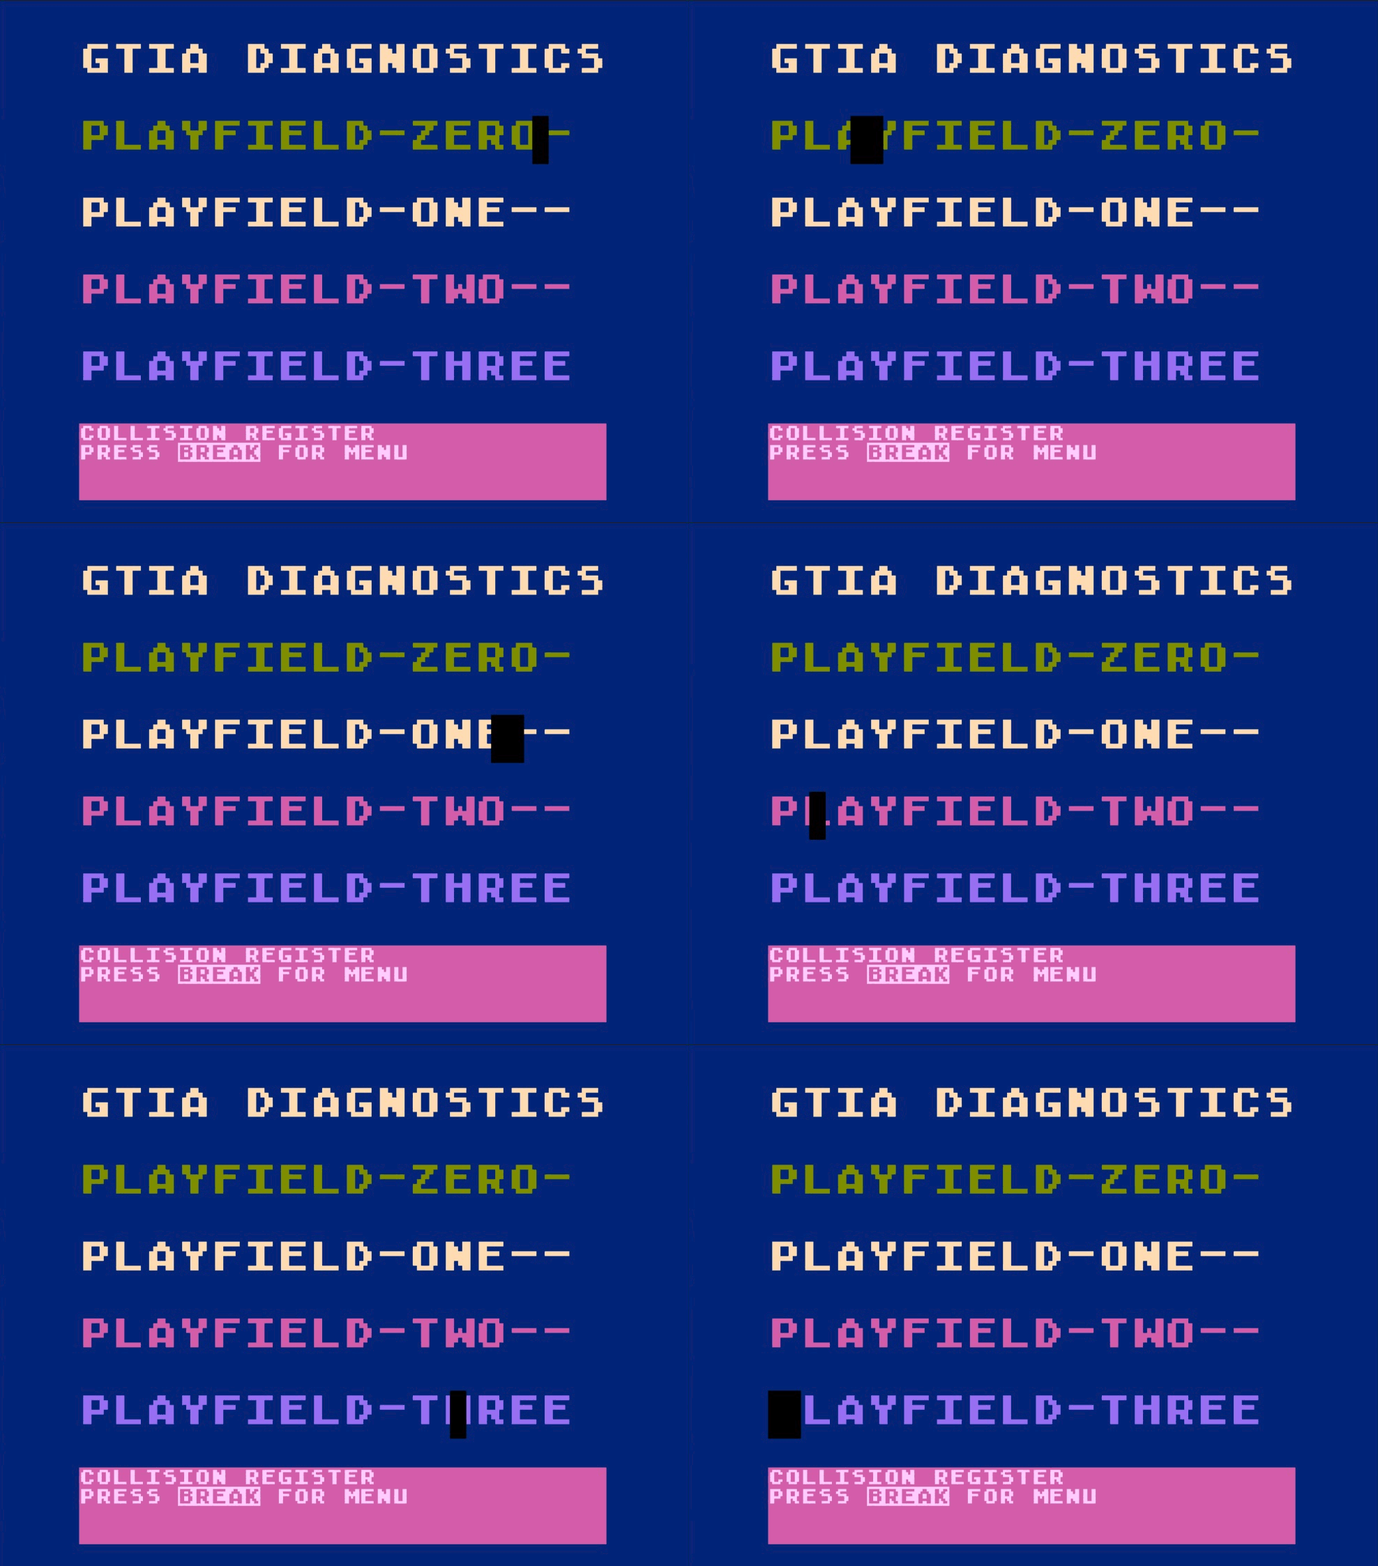
The GTIA Diagnostics test comprehensively exercises the GTIA I.C. by verifying Player/Missile Graphics (PMG), playfield priority, and collision-detection functions. The test is performed in three phases, shown in figures 5-6 through 5-8. While the software automatically verifies and tabulates collision-detection failures, the operator must observe each phase to confirm that the graphics appear and behave as described.
GTIA Phase 1: PMG Sizing, Motion & Playfield Collisions
As shown in figure 5-6, four horizontal playfields labeled PLAYFIELD ZERO through THREE span the screen while groups of player- and missile-generated rectangles move between them. This phase verifies player and missile sizing and movement, and exercises the GTIA playfield-collision registers as the objects traverse each of the four playfields. When a collision is detected, the software verifies that it is attributed to the correct playfield.
Figure 5-6. GTIA Diagnostics Phase 1
GTIA Phase 2: PMG Collision Detection
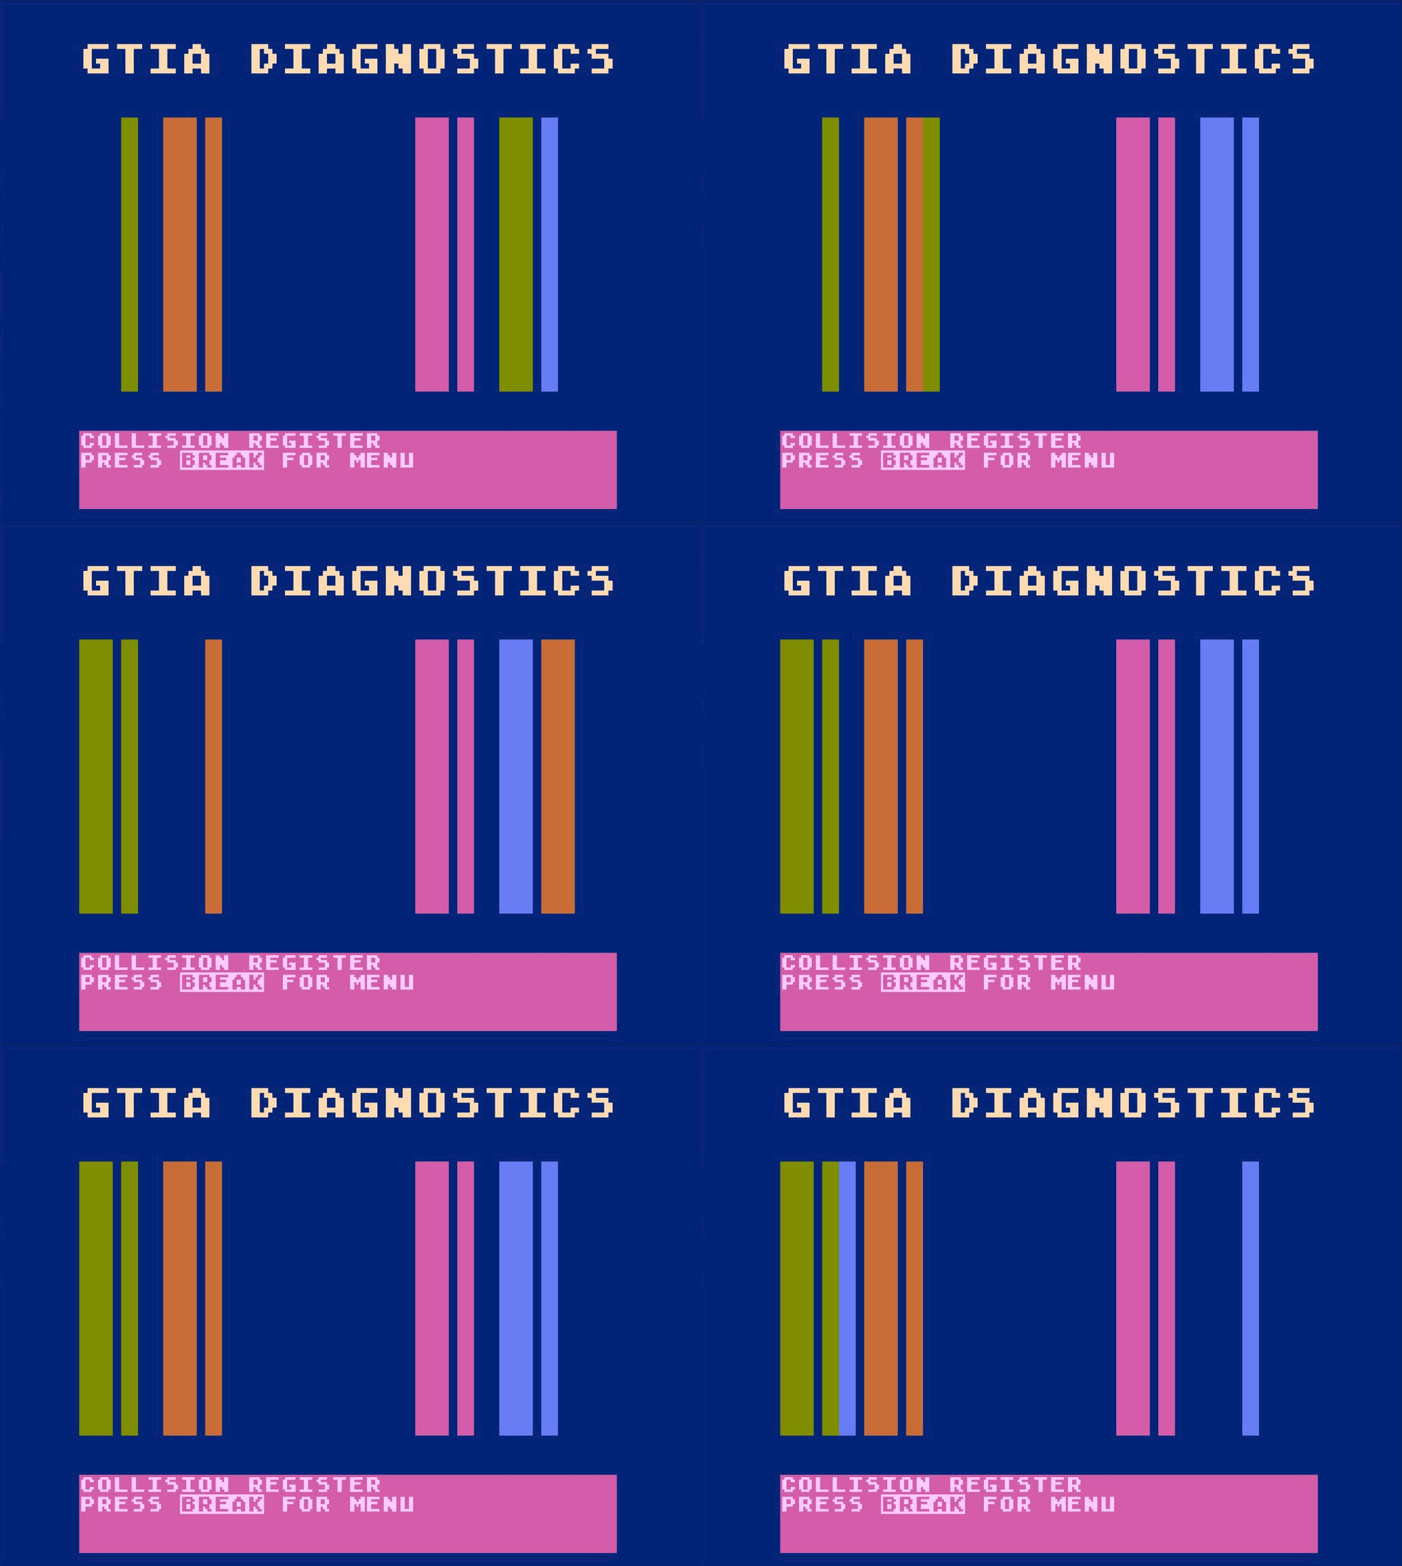
Figure 5-7 shows two groups of rotating vertical bars. The narrow bars represent missiles, while the wide bars represent players. Each player is moved through the player and missile positions to exercise the player-to-player and missile-to-player collision registers and verify that reported collisions are attributed to the correct player.
Figure 5-7. GTIA Diagnostics Phase 2
GTIA Phase 3: PMG/Playfield Priority
Figure 5-8 verifies GTIA display priority by displaying the words UNDER and OVER intersected by vertical bars. The words indicate the expected priority of the vertical bars relative to the text. Accordingly, the bars should appear behind the word UNDER and in front of the word OVER. The text window at the bottom of the screen identifies the player, missile, and playfield priority relationship currently being verified.
Figure 5-8. GTIA Diagnostics Phase 3
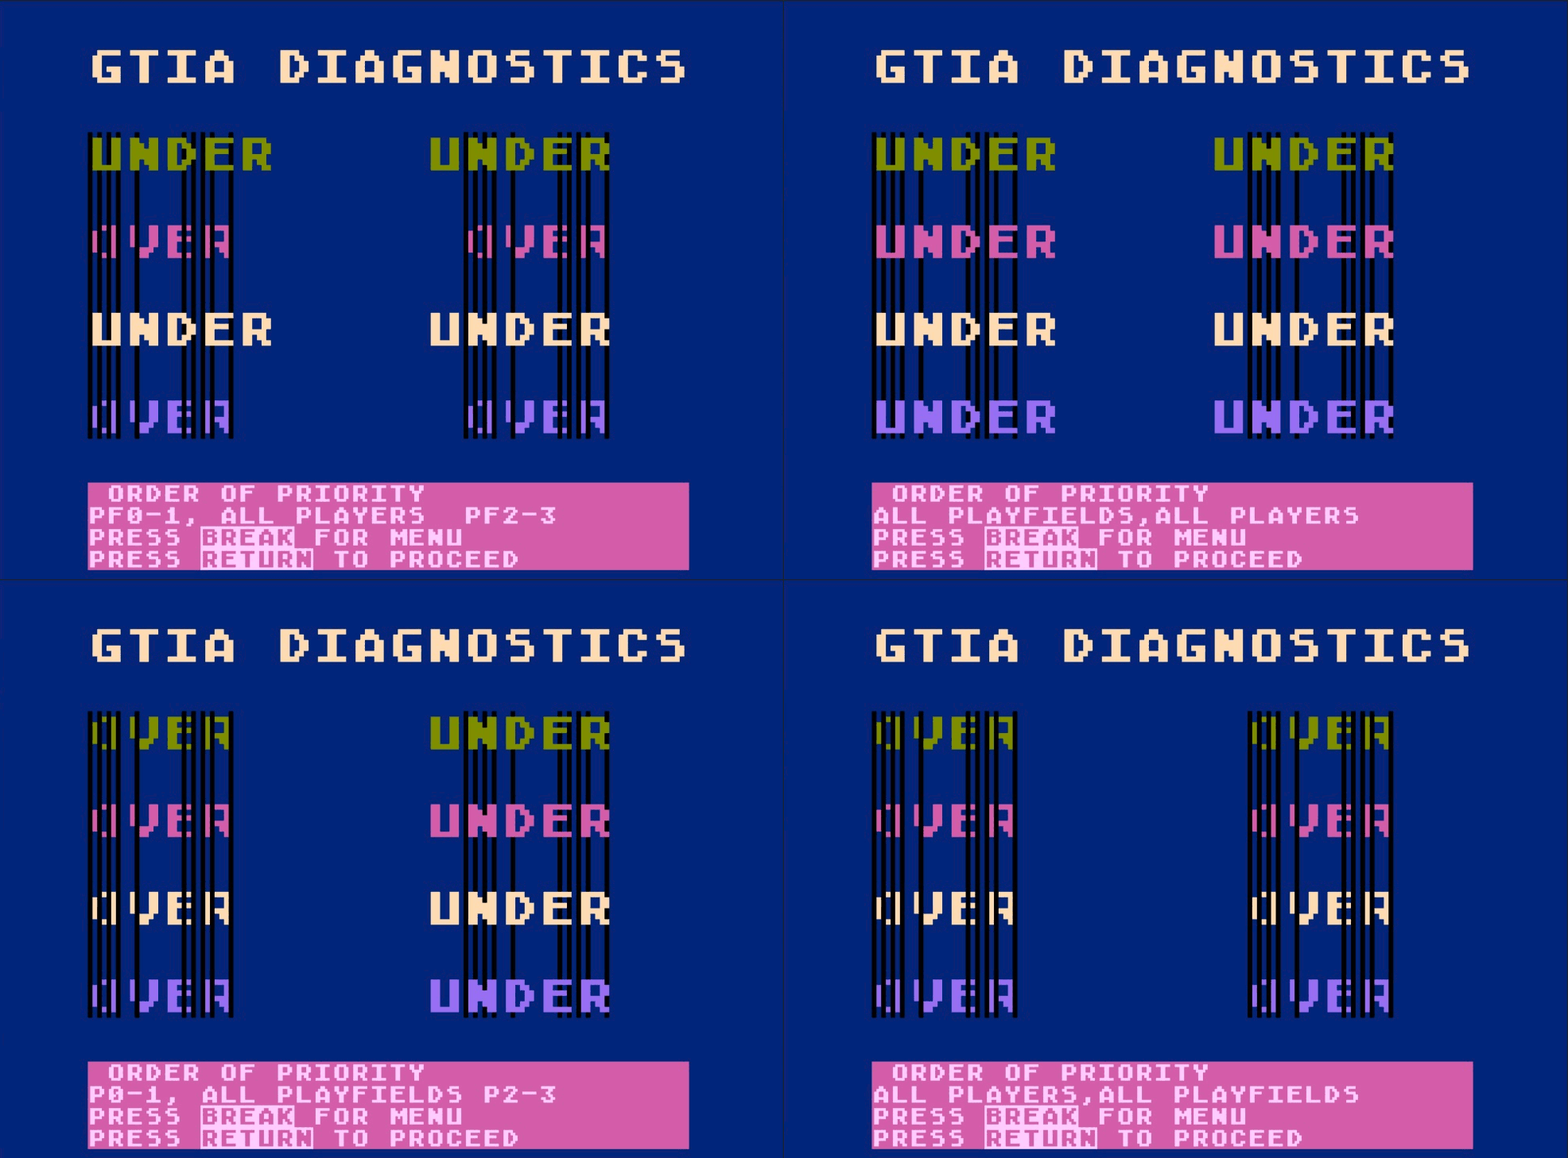
Troubleshooting: Missing or malformed graphics, incorrect player or missile sizing, improper movement, incorrect priority relationships, or collision-identification failures indicate a problem with the GTIA I.C. or its associated circuitry.
I/O Port Tests
The I/O Port Test verifies operation of the controller and serial I/O interfaces. A properly connected and operational port box is required to perform the following tests:
- Voltage Verification: Verifies the +5 V and ground lines on each I/O port.
- Controller Port Data Lines: Verifies bidirectional operation of the controller port data lines.
- Trigger Lines: Verifies operation of the trigger inputs on each controller port.
- Potentiometer Lines: Verifies operation of the potentiometer inputs on each controller port.
- Serial Interface: Verifies the serial motor control, command, interrupt, data input, and data output lines.
- Serial Communications: Verifies asynchronous and synchronous serial communications over the full range of supported baud rates.
Voltage Test
Because the Voltage Test is not tabulated by the CPS SuperSALT software, the operator must determine the pass/fail condition by observing the real-time test results displayed on-screen. The Voltage Test screen (figures 5-9 through 5-11) displays the measured voltages applicable to the console under test. Measurements within the acceptable limits are displayed in green, while measurements outside those limits are displayed in red. The corresponding voltage limits are provided in table 5-1 for reference.
Figure 5-9. Atari 400/800 Voltage Test
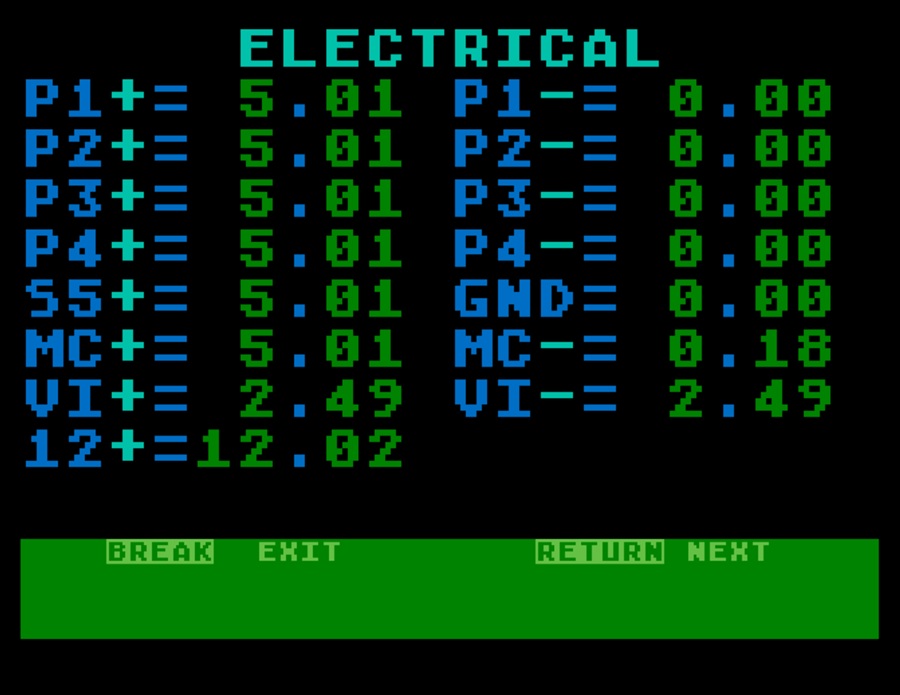
Figure 5-10. Atari 1200XL Voltage Test
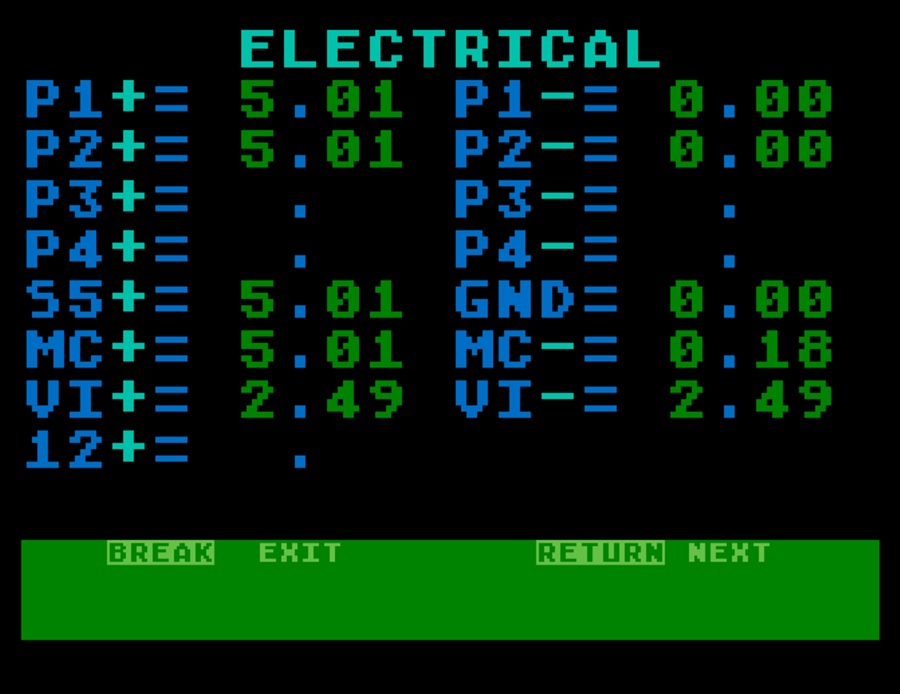
Figure 5-11. Atari XL/XE Voltage Test
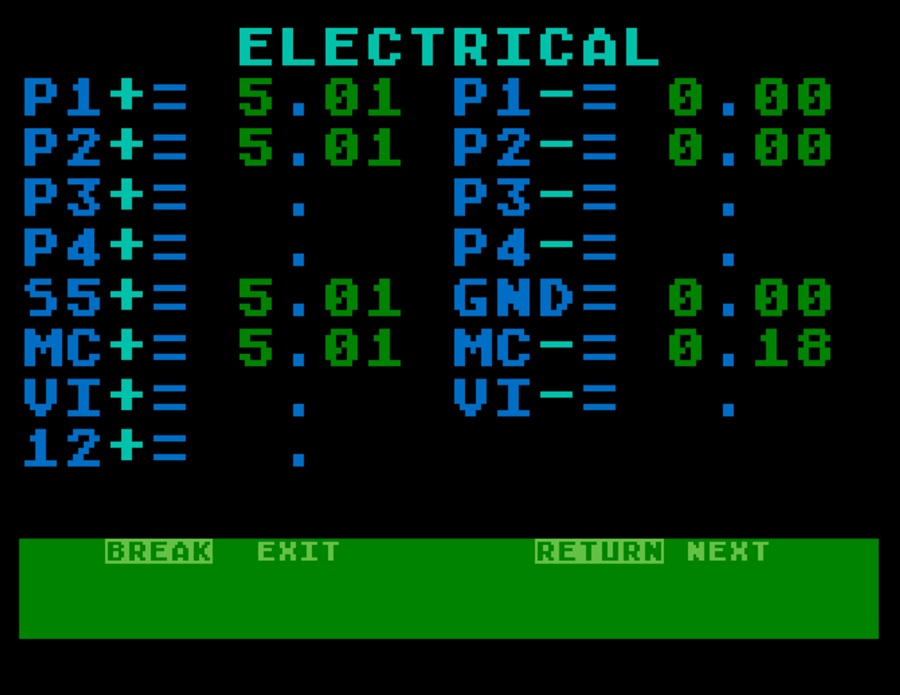
Table 5-1. Voltage Test Limits
| Parameter | High Limit | Low Limit |
|---|---|---|
| P1~P4+ | +5.24V | +4.72V |
| P1~P4- | +0.748V | +0.00V |
| S5+ | +5.24V | +4.72V |
| GND | +0.21V | +0.00V |
| MC+ | +5.24V | +2.85V |
| MC- | +0.748V | +0.00V |
| VI+ | +4.048V | +0.936V |
| VI- | +4.048V | +0.936V |
VI+ and VI- apply only to the Atari 400, 800, and 1200XL, where they represent the positive and negative outputs of the current-to-voltage converter. These values do not indicate current directly, but rather the converter output voltage, which is calibrated to a nominal value of 2.50 for a healthy, unmodified Atari 800 (48K) operating at idle.
When testing other console configurations, modest deviations from the 2.50 baseline are normal and may result from hardware upgrades, modifications, or memory configuration. However, large deviations or significant differences between VI+ and VI- may indicate abnormal current consumption.
Enhanced Software: On XL/XE consoles, the software normally omits the VI+, VI-, and +12 V measurements because those signals are not present. However, the enhanced software automatically performs these tests whenever it detects voltages above a predefined threshold, allowing modified systems such as a 1200XL configured to emulate an 800XL to be fully tested.
Troubleshooting: If all or most voltage measurements fail, first verify that the port box is properly connected, powered, and configured before troubleshooting the console. After correcting any setup problems, rerun the I/O Port Test.
Important: When using the original Atari diagnostic software, the Error Display must be disabled. Otherwise, the Voltage Test will report errors.
I/O Test Progress
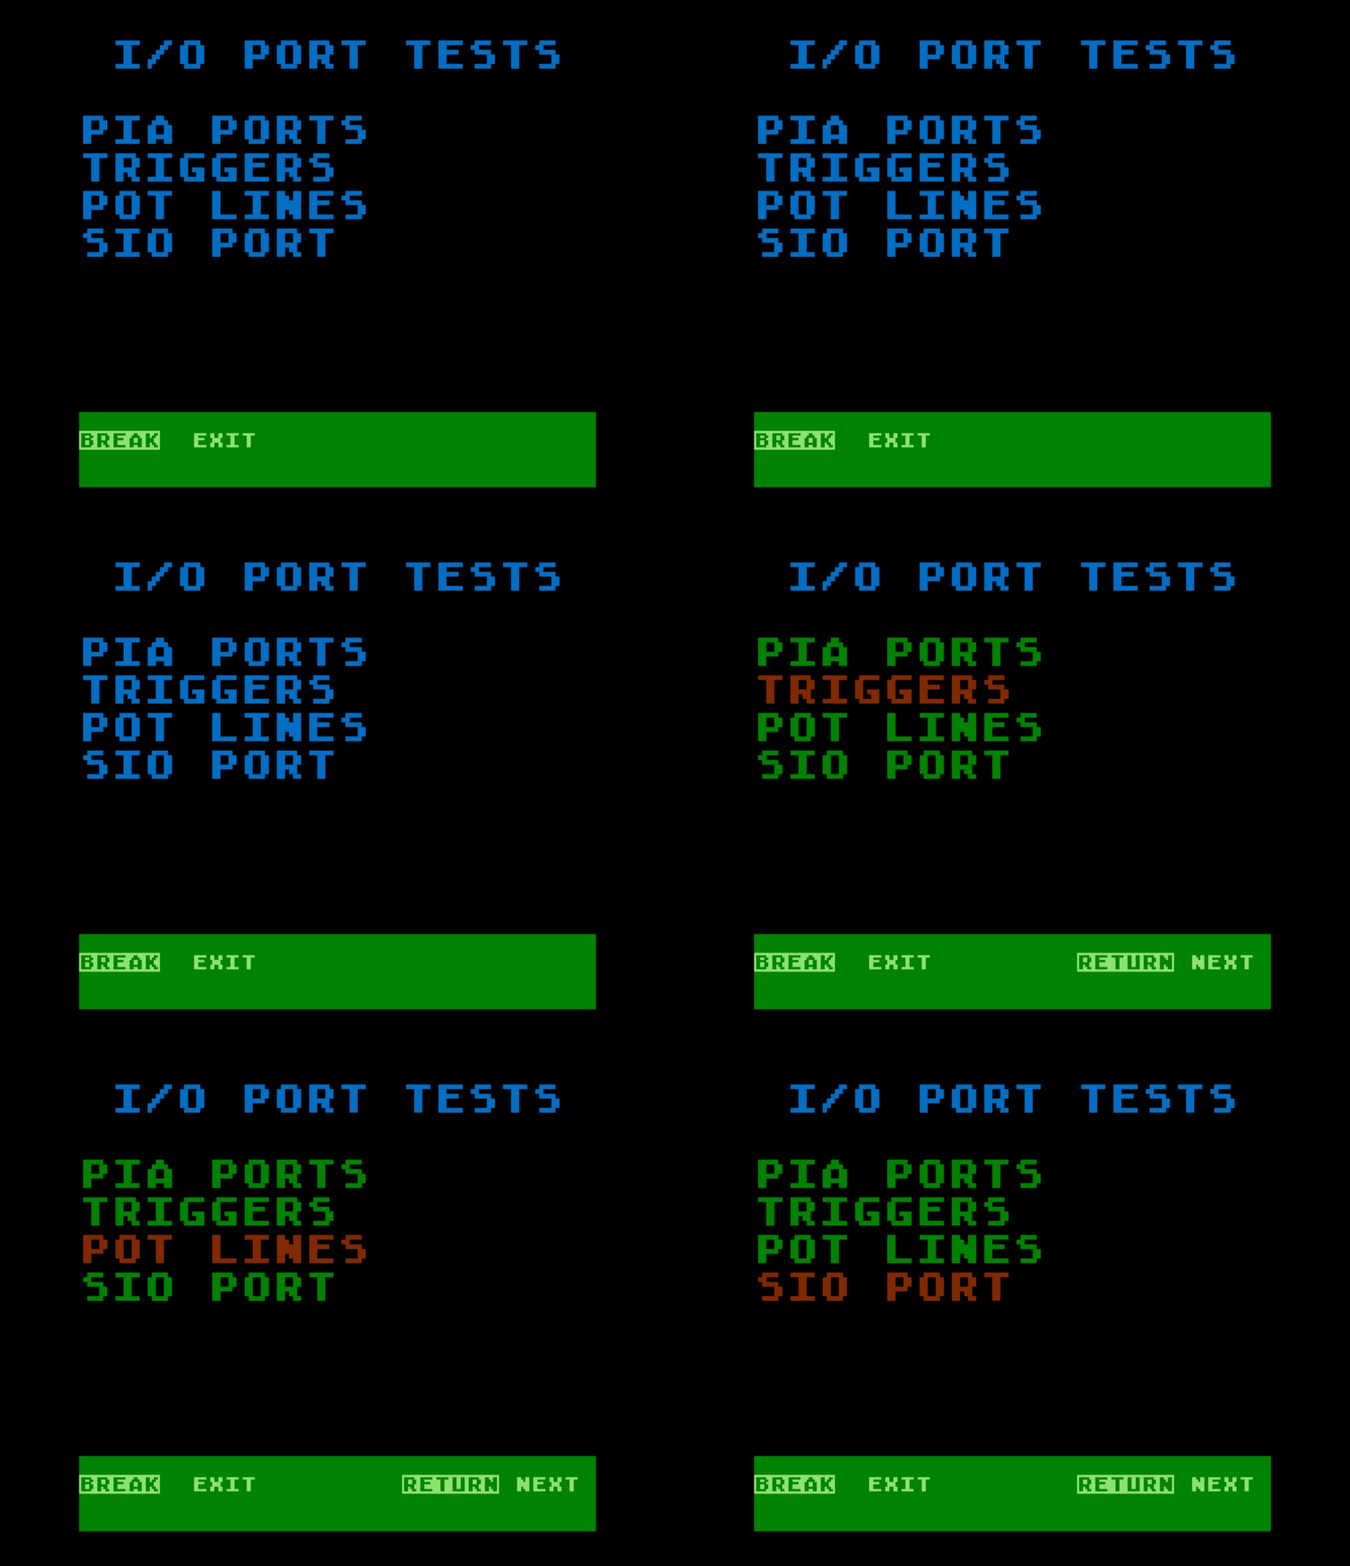
Following the Voltage Test, the I/O Test Progress screen (figure 5-12) displays the result of each remaining I/O subtest as it is completed. Each subsequent test name appears in green if the test passes, or red if one or more failures are recorded. In figure 5-12, TRIGGER LINES is shown in red because the test recorded at least one trigger-line failure. Detailed results can later be reviewed using the Error Summary.
Figure 5-12. I/O Test Progress
PIA Ports Test
The PIA Ports Test verifies that each programmable input/output data line connected to the console’s controller ports functions properly as both an input and an output. Detailed results are retained for the Error Summary, where failures are identified by the affected PIA bit.
SIO Port
The SIO Port Test verifies the console’s ability to communicate through its Serial Input/Output (SIO) port using asynchronous and synchronous data transfers. This test requires the test assembly to be properly connected and powered.
Asynchronous reception is tested at six baud rates: 300, 600, 1200, 2400, 4800, and 9600. At each rate, the test assembly transmits a fixed $55 data pattern to the console, which checks the received character for timeout, framing, and data errors.
Synchronous communication is tested at 19,200 baud in two configurations. The first uses a clock generated by the console under test; the second uses an external clock supplied by the test assembly. Together, these tests verify the console’s ability to transmit and receive synchronous data with either clock source.
Detailed results are retained for the Error Summary, where failures are reported in the following categories:
- SYNC BAUD: synchronous communication failures
- ASYNC DATA: incorrectly received asynchronous data
- ASYNC FRAMING: asynchronous framing errors
- ASYNC TIMEOUT: asynchronous data not received within the permitted time
The software retries certain communication failures to distinguish persistent faults from transient errors. A failure is recorded when the applicable retry limit or receive timeout is reached.
Trigger Lines
The Trigger Lines Test verifies that each applicable controller-port trigger input responds correctly in both states when driven through the test assembly. All four trigger lines are tested on Atari 400/800 computers, while the two available trigger lines are tested on XL/XE computers. A failure may indicate a fault in the console’s trigger-input circuitry, the controller-port connection, the SIO Motor Control path used to operate the test assembly, or the test assembly itself. Detailed results are retained for the Error Summary, where failures are identified by trigger line.
Pot Lines
The Pot Lines Test verifies that each applicable controller-port potentiometer input produces a reading within the expected range when connected through the test assembly. All eight pot lines are tested on Atari 400/800 computers, while the four available pot lines are tested on XL/XE computers. A failure may indicate a fault in POKEY’s potentiometer-input circuitry, a controller-port connection, the connecting cables, or the test assembly itself. Detailed results are retained for the Error Summary, where failures are identified by pot line.
Timers
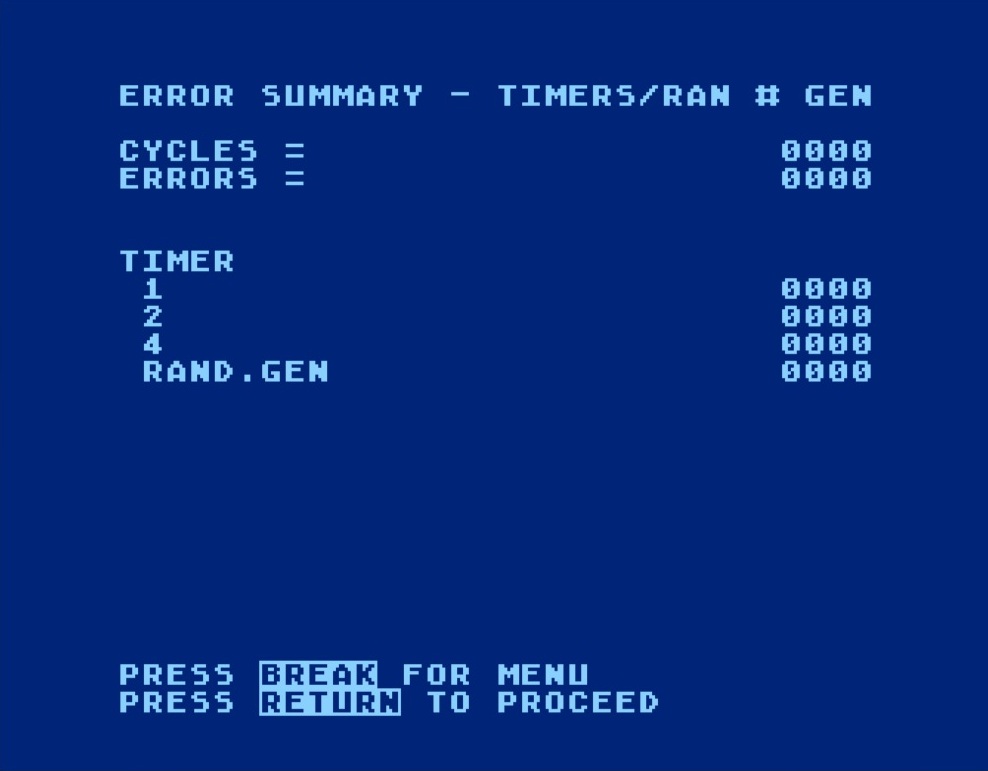
The Timers Test verifies POKEY Timers 1, 2, and 4 by confirming that each timer generates its interrupt within the expected interval. It also verifies that POKEY’s random-number generator produces changing values. A failure may indicate a fault in POKEY, its clock source, or the associated interrupt circuitry. Detailed results are retained for the Error Summary, where failures are reported separately for Timers 1, 2, and 4 and the random-number generator.
OS ROM Checksum
This test verifies the integrity of the system ROMs by calculating a checksum for each ROM and comparing it to the checksum value stored within the ROM. If the calculated and stored values match, the test passes (see figure 5-13). A mismatch indicates a fault in the ROM or associated circuitry.
Figure 5-13. Atari 400/800 OS ROM Checksum
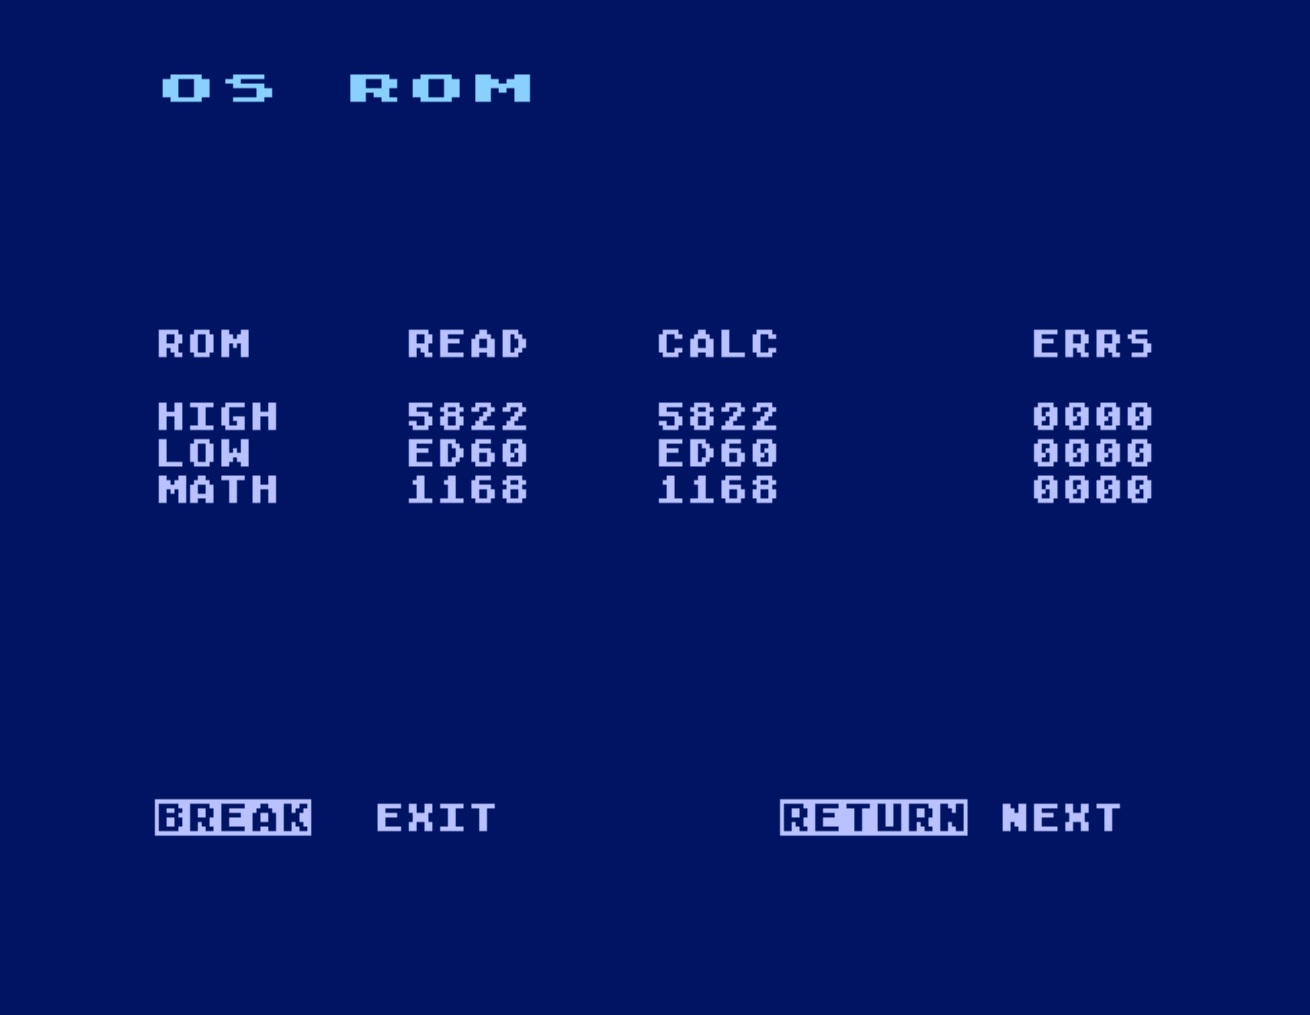
Note: XL/XE consoles do not contain a separate MATH ROM. Accordingly, the MATH checksum fields are displayed as 0000.
RAM Test
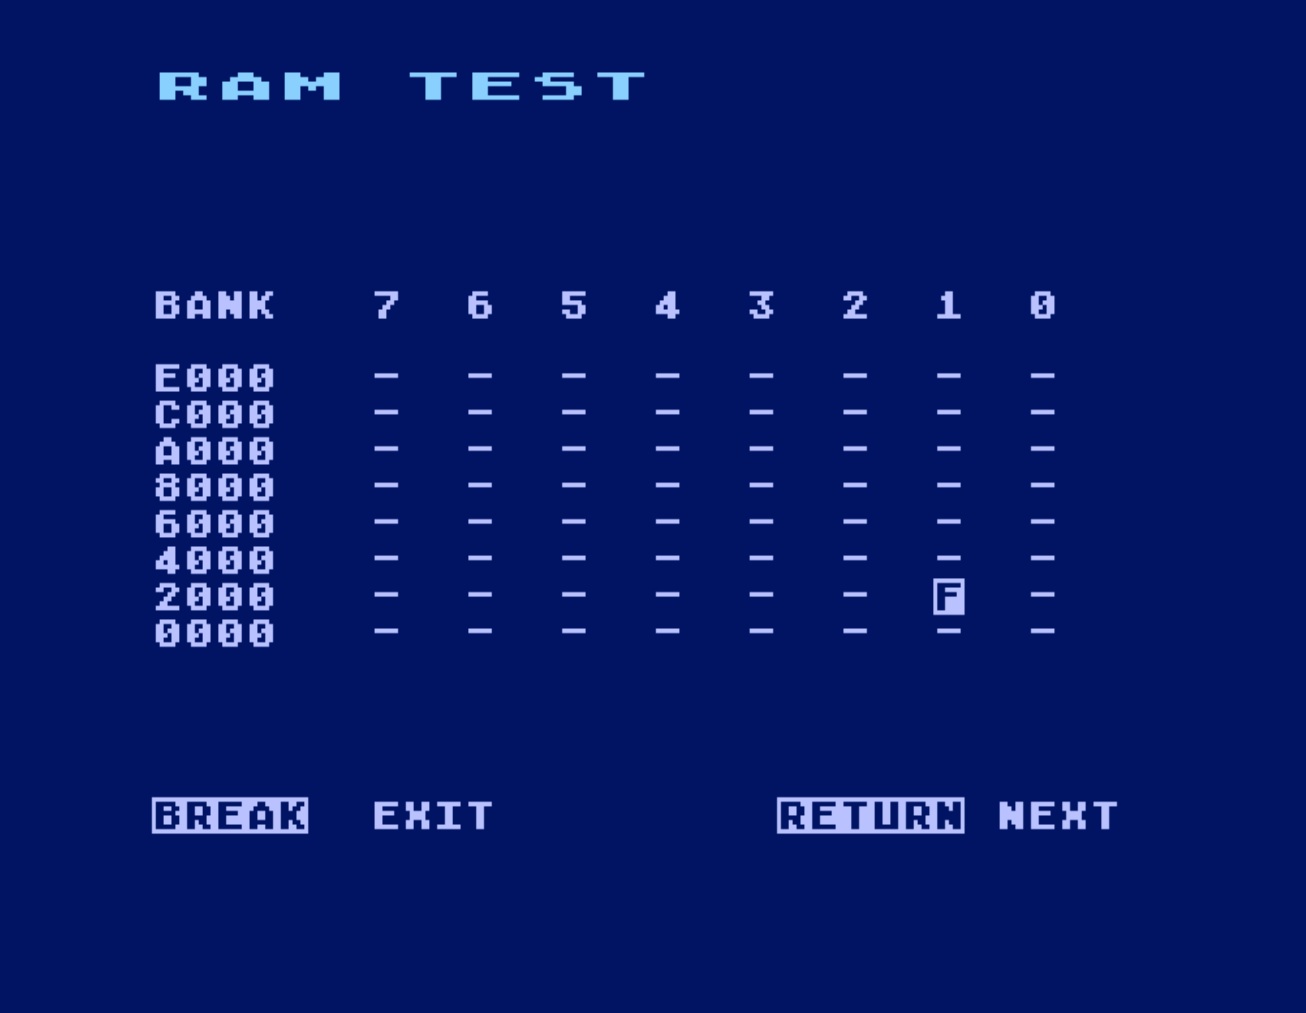
The RAM Test verifies the integrity of system memory by performing a series of diagnostic patterns designed to detect addressing, data, and memory refresh faults. During portions of the test, the display is temporarily blanked while video memory is tested and refresh timing is verified. The duration depends on the amount of installed memory; for example, a 48KB system typically blanks the display for approximately 33 seconds before the results screen appears (figures 5-14 through 5-16).
Figure 5-14. RAM Test Screen
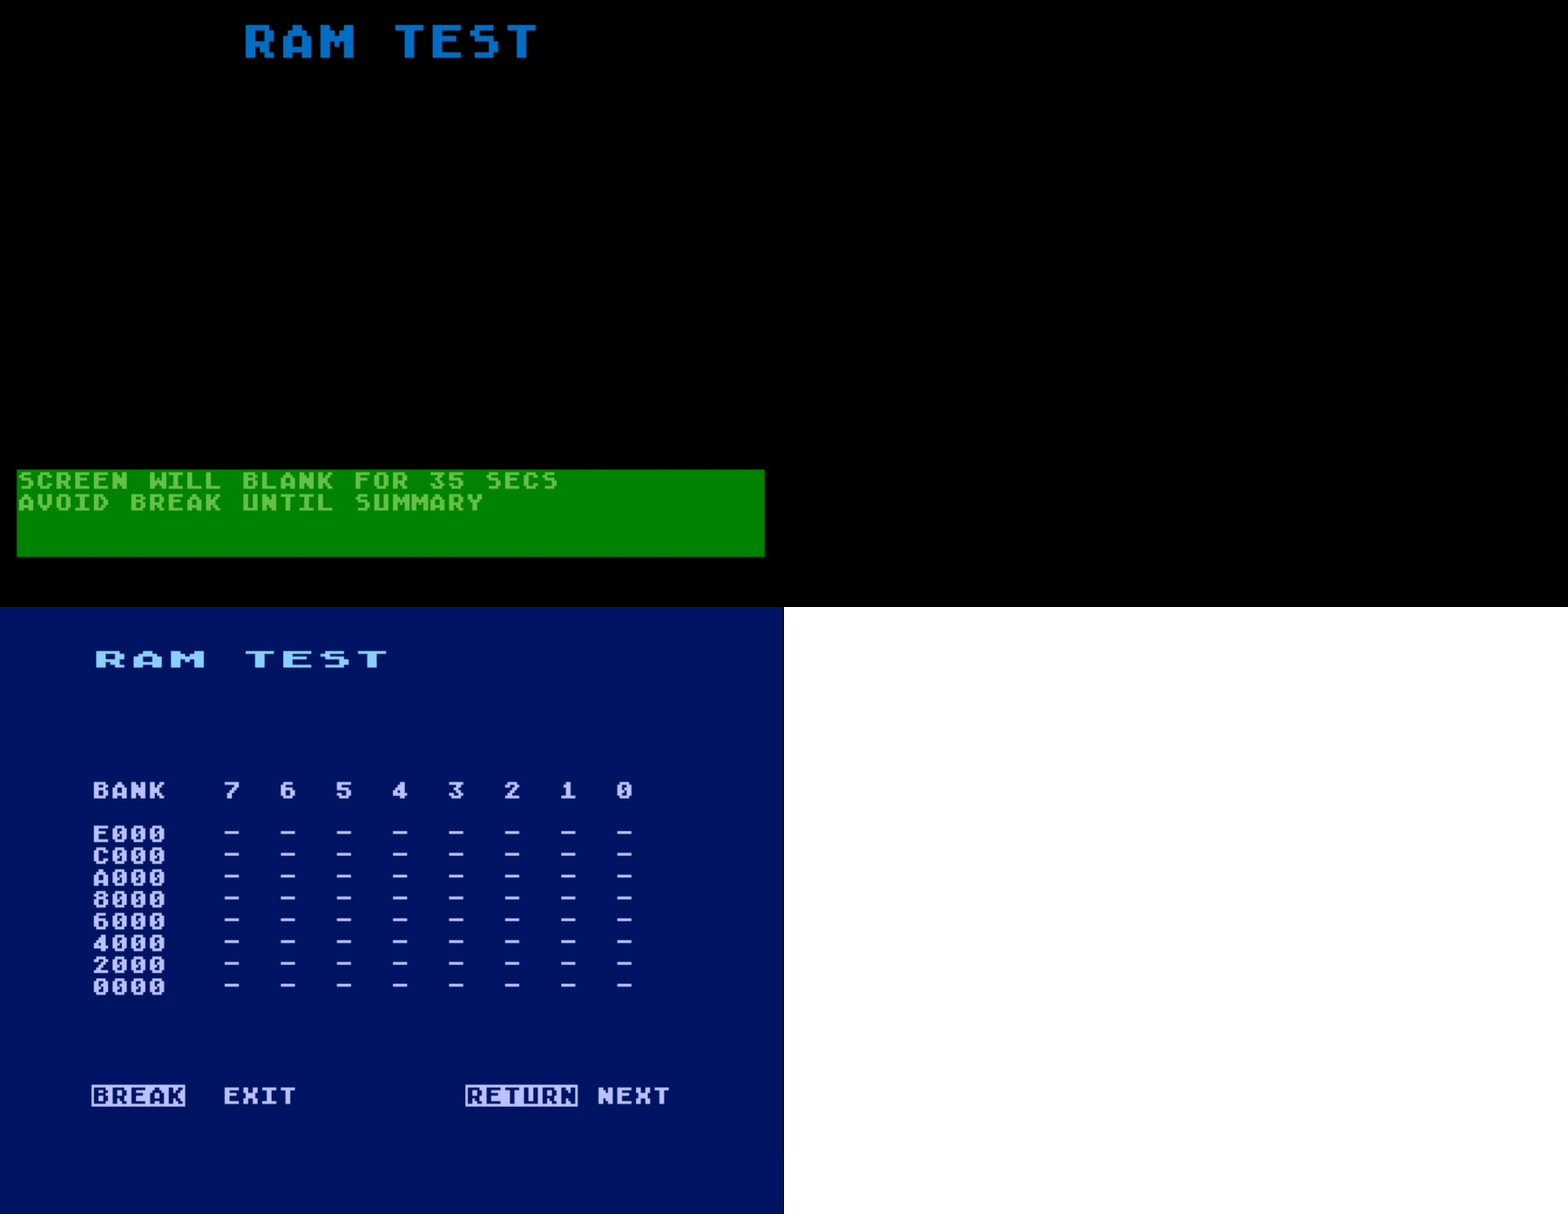
Note: The message “DO NOT PRESS BREAK UNTIL SUMMARY“ is displayed only on consoles with 32KB or more of installed RAM. Because the RAM Test temporarily overwrites display memory and restores it upon completion, pressing BREAK before the summary screen appears will interrupt the process, leaving the display corrupted.
Figure 5-15. RAM Test Summary Showing a Failure
RAM Test Methods
The RAM Test performs the following diagnostic procedures:
- Marching 1’s through memory to test internal chip decoding.
- Marching 0’s through memory to test internal chip decoding.
- Fill memory with a variable data pattern.
- Fill memory with the complement of the previous pattern.
- Test using constant data patterns.
- Test using random data patterns.
- Verify memory refresh timing during the blank-screen interval.
Tone Test
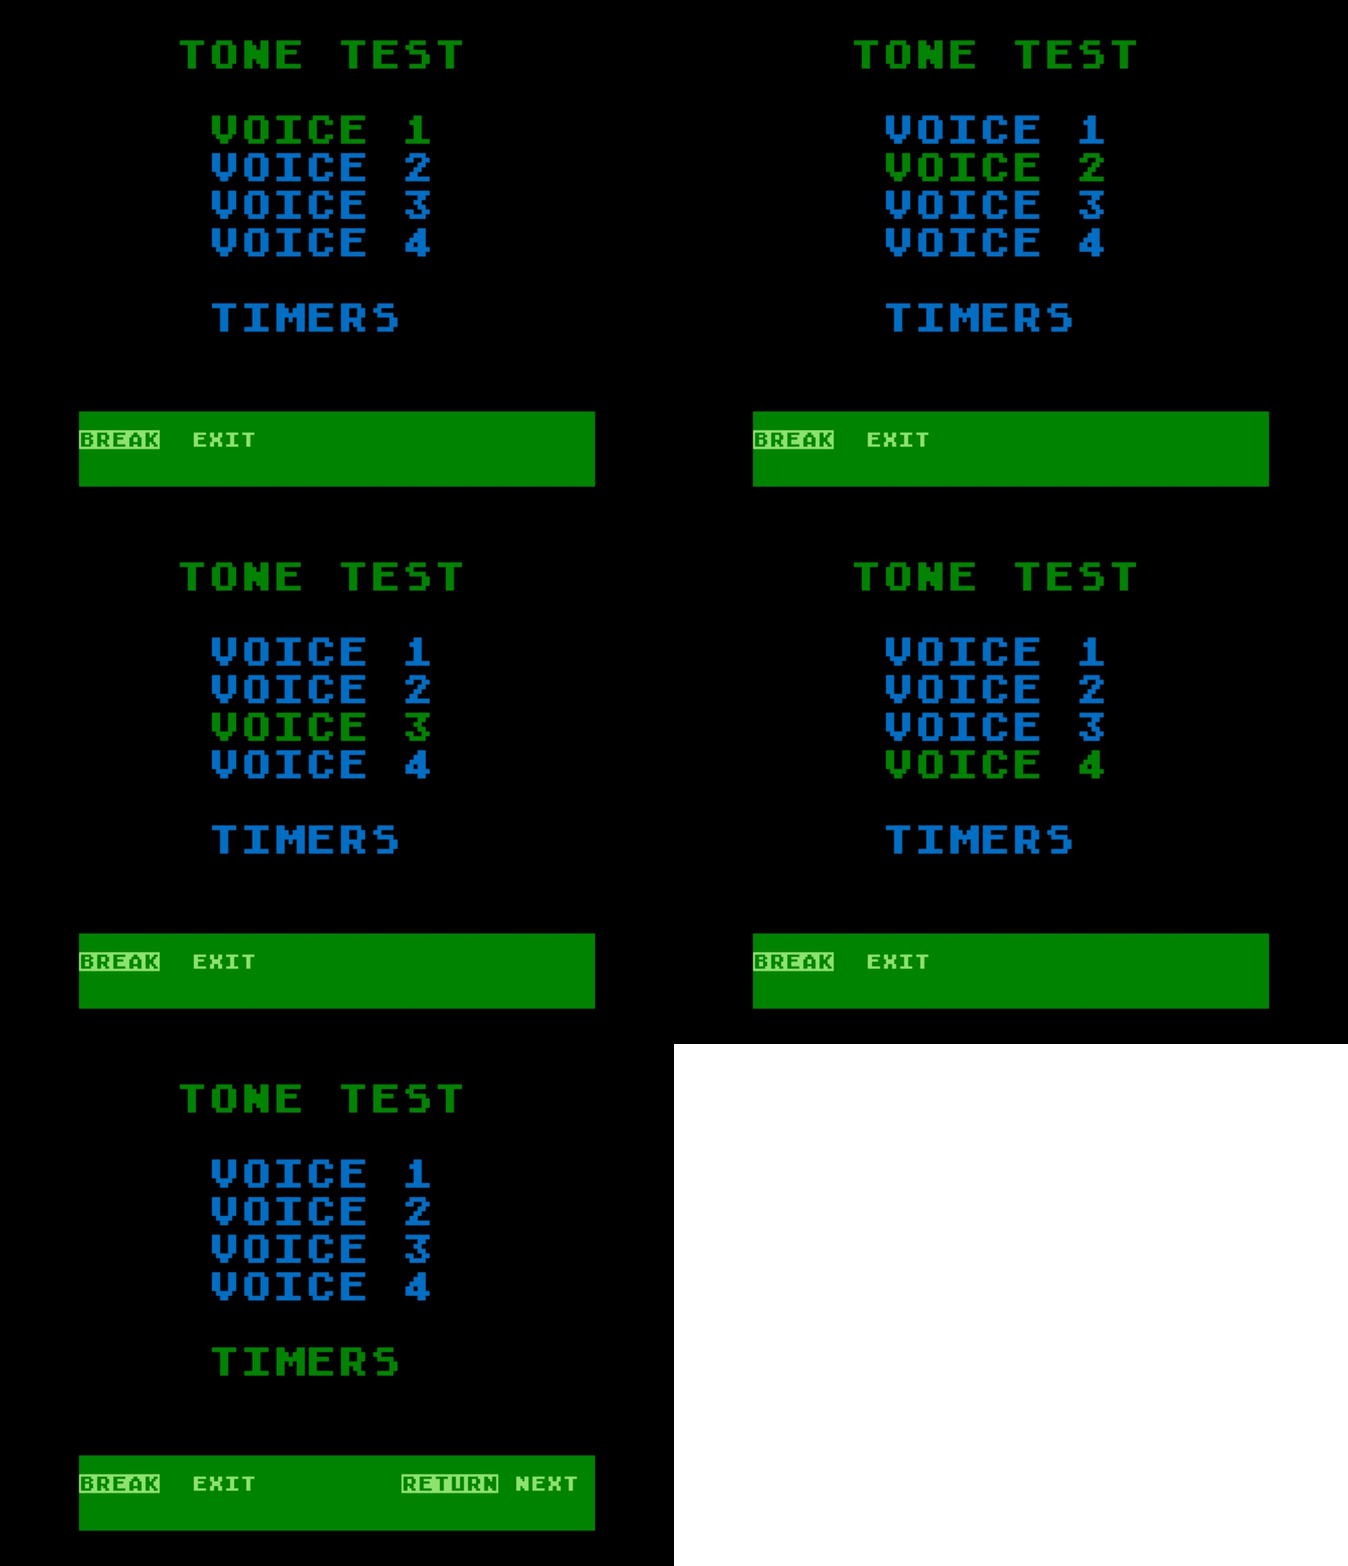
The Tone Test verifies operation of the four POKEY sound registers by generating a descending sweep of tones through each register in succession. As each register is tested, its corresponding label is highlighted on the screen (figure 5-16). Brief pauses separate the tone sweeps, allowing the operator to distinguish between the four sound registers. Missing or incorrect tones indicate a fault in the POKEY or the audio output circuitry. If the console is connected to a television through the RF output, the 4.5MHz circuitry should also be considered as a possible cause.
Figure 5-16. Tone Test
Video Test
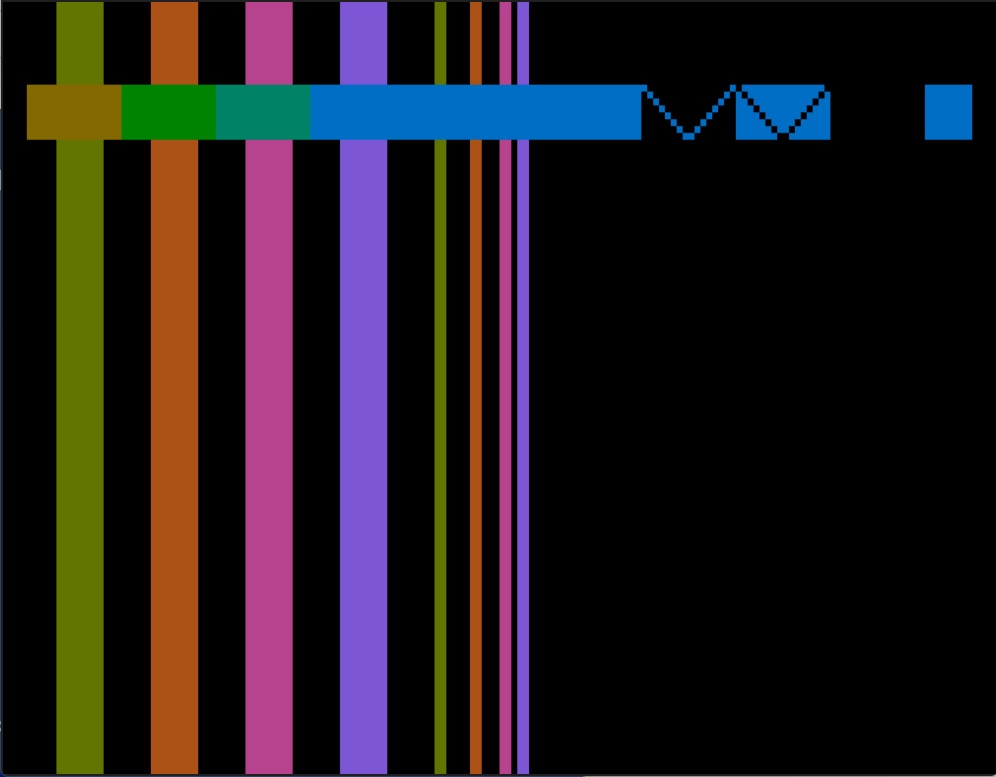
The Video Test exercises the console’s video circuitry using a variety of display patterns. The screen shown in figure 5-17 consists of wide and narrow vertical color bars, a horizontal color bar, diagonal line patterns, and a solid square. All elements should appear stable, properly aligned, and free of missing, distorted, or incorrectly colored regions. The vertical bars are generated using both playfield and Player/Missile Graphics and should appear as continuous, uniform lines with no visible discontinuities or misalignment.
Figure 5-17. Video Test
Xternal Audio Test
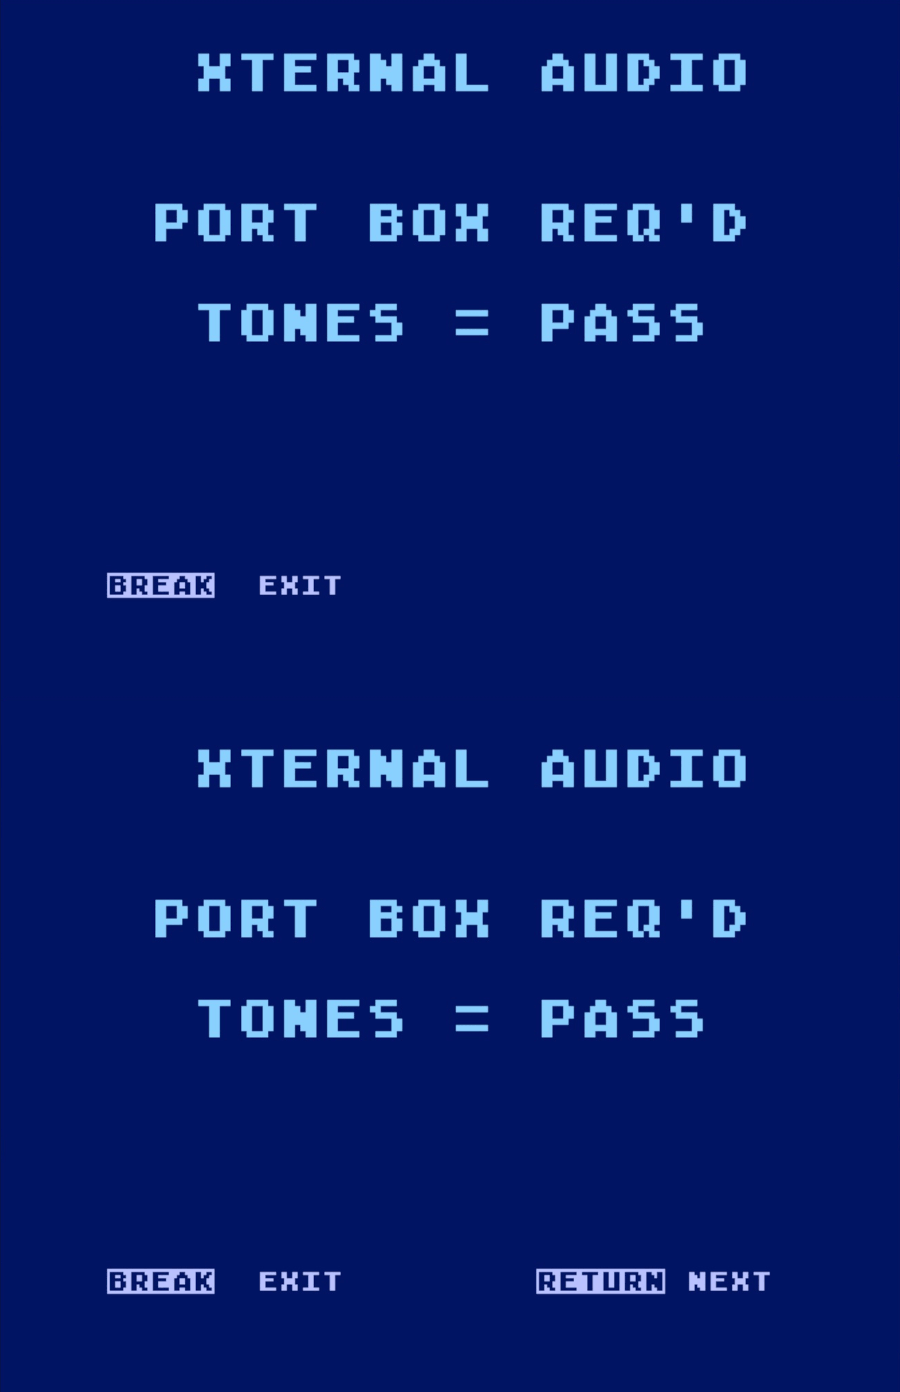
This test uses the test assembly to simulate an external audio source, such as a cassette recorder or other audio device connected to the serial I/O (SIO) port. If a short melody is heard, the test passes. Figure 5-18 shows the Xternal Audio Test screen.
Figure 5-18. Xternal Audio Test
If no melody is heard, verify the following before troubleshooting the console:
- TV or monitor volume is turned up.
- Test assembly is properly connected.
- Test assembly is powered on.
- Test assembly Tone switch is set correctly.
- Inspect the UUT SIO connector for corrosion or damage.
- Verify the SIO cable has continuity across all 13 conductors.
If the problem persists, possible causes include:
- Incorrect 4.5MHz oscillator adjustment (RF output only).
- Faulty audio mixer IC (U8) or associated support circuitry.
- Faulty POKEY IC.
Interactive Diagnostic Utilities
The following utilities are available only from the Individual Tests menu and require operator interaction. Unlike the automated diagnostic tests, they are intended to evaluate external accessories or provide specialized service functions.
Joystick Test
This test verifies the operation of a joystick and its trigger button. It is intended for testing a joystick accessory using a known functional console.
Figure 6-1. Joystick Test
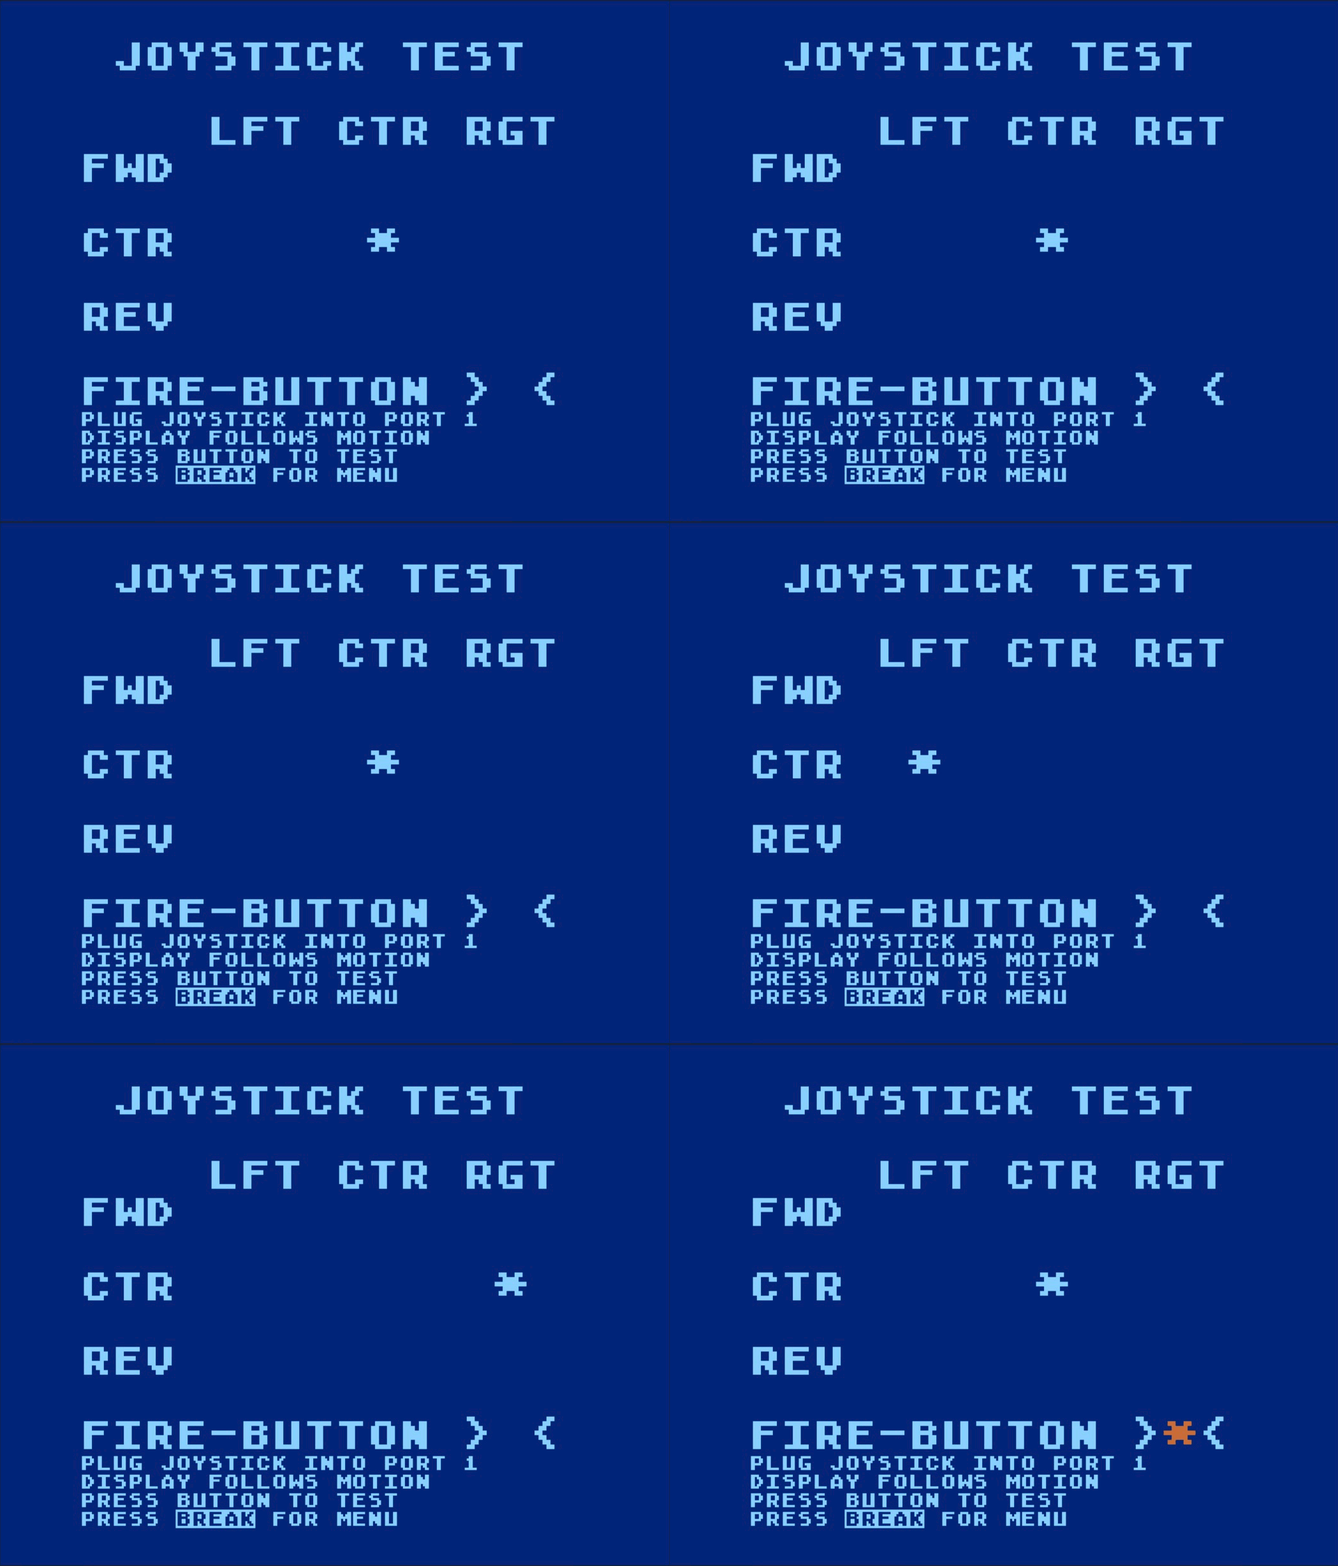
Connect the joystick to controller port 1. The asterisk (*) shown in figure 6-1 should remain centered when the joystick is at rest and should move in the corresponding direction as the joystick is operated. Verify all eight joystick positions and confirm that the asterisk returns to the center when the joystick is released. Pressing the trigger should cause a red asterisk to appear beside FIRE BUTTON. Failure of any of these checks indicates a faulty joystick.
Keyboard Test
This utility verifies the operation of the console keyboard, including the special function keys. All keys may be tested except BREAK and RESET, which are verified by their normal operation.
Figure 6-2. Keyboard Test
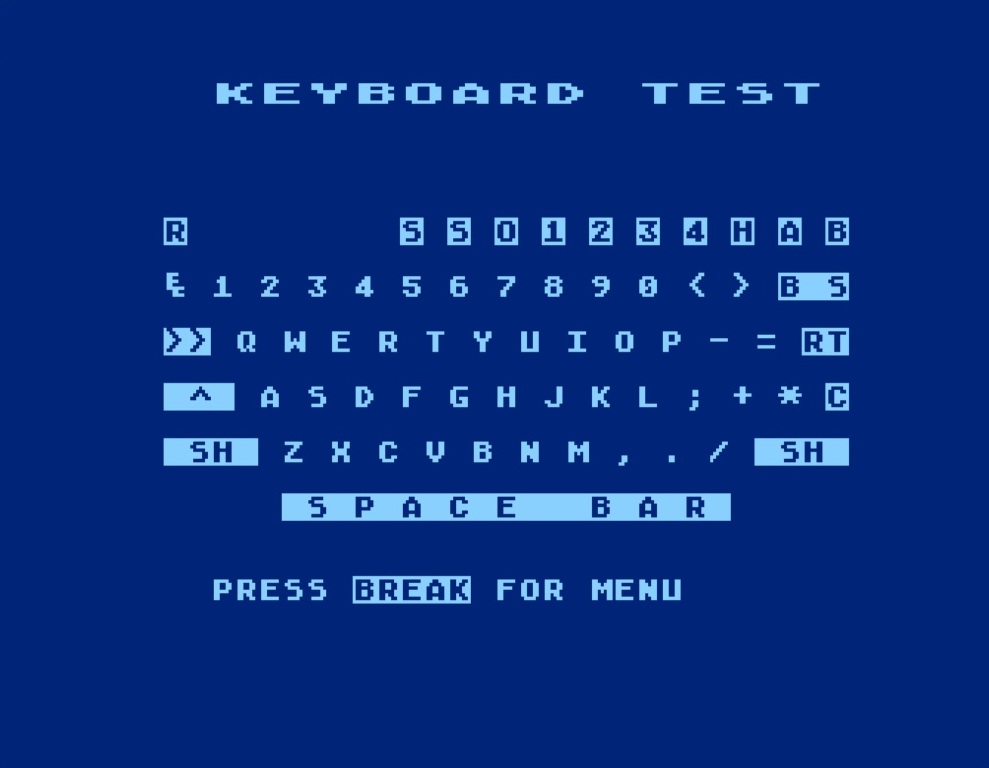
The keyboard layout display (see figure 6-2) is fixed and always represents an Atari 1200XL keyboard, regardless of the console under test. Consequently, some displayed keys are not applicable to all console models.
As each key is pressed, the corresponding key on the display flashes in inverse video and a tone is heard. When testing modified keys, hold CONTROL or SHIFT while pressing the desired key.
Pressing RESET should reset the console and return to the software splash screen. Pressing BREAK should return to the Individual Tests menu.
Failure of a key to register or produce a tone may indicate:
- Faulty keyboard switch.
- Faulty keyboard cable/membrane.
- Faulty keyboard decoder circuitry.
- Faulty POKEY IC.
Paddle Test
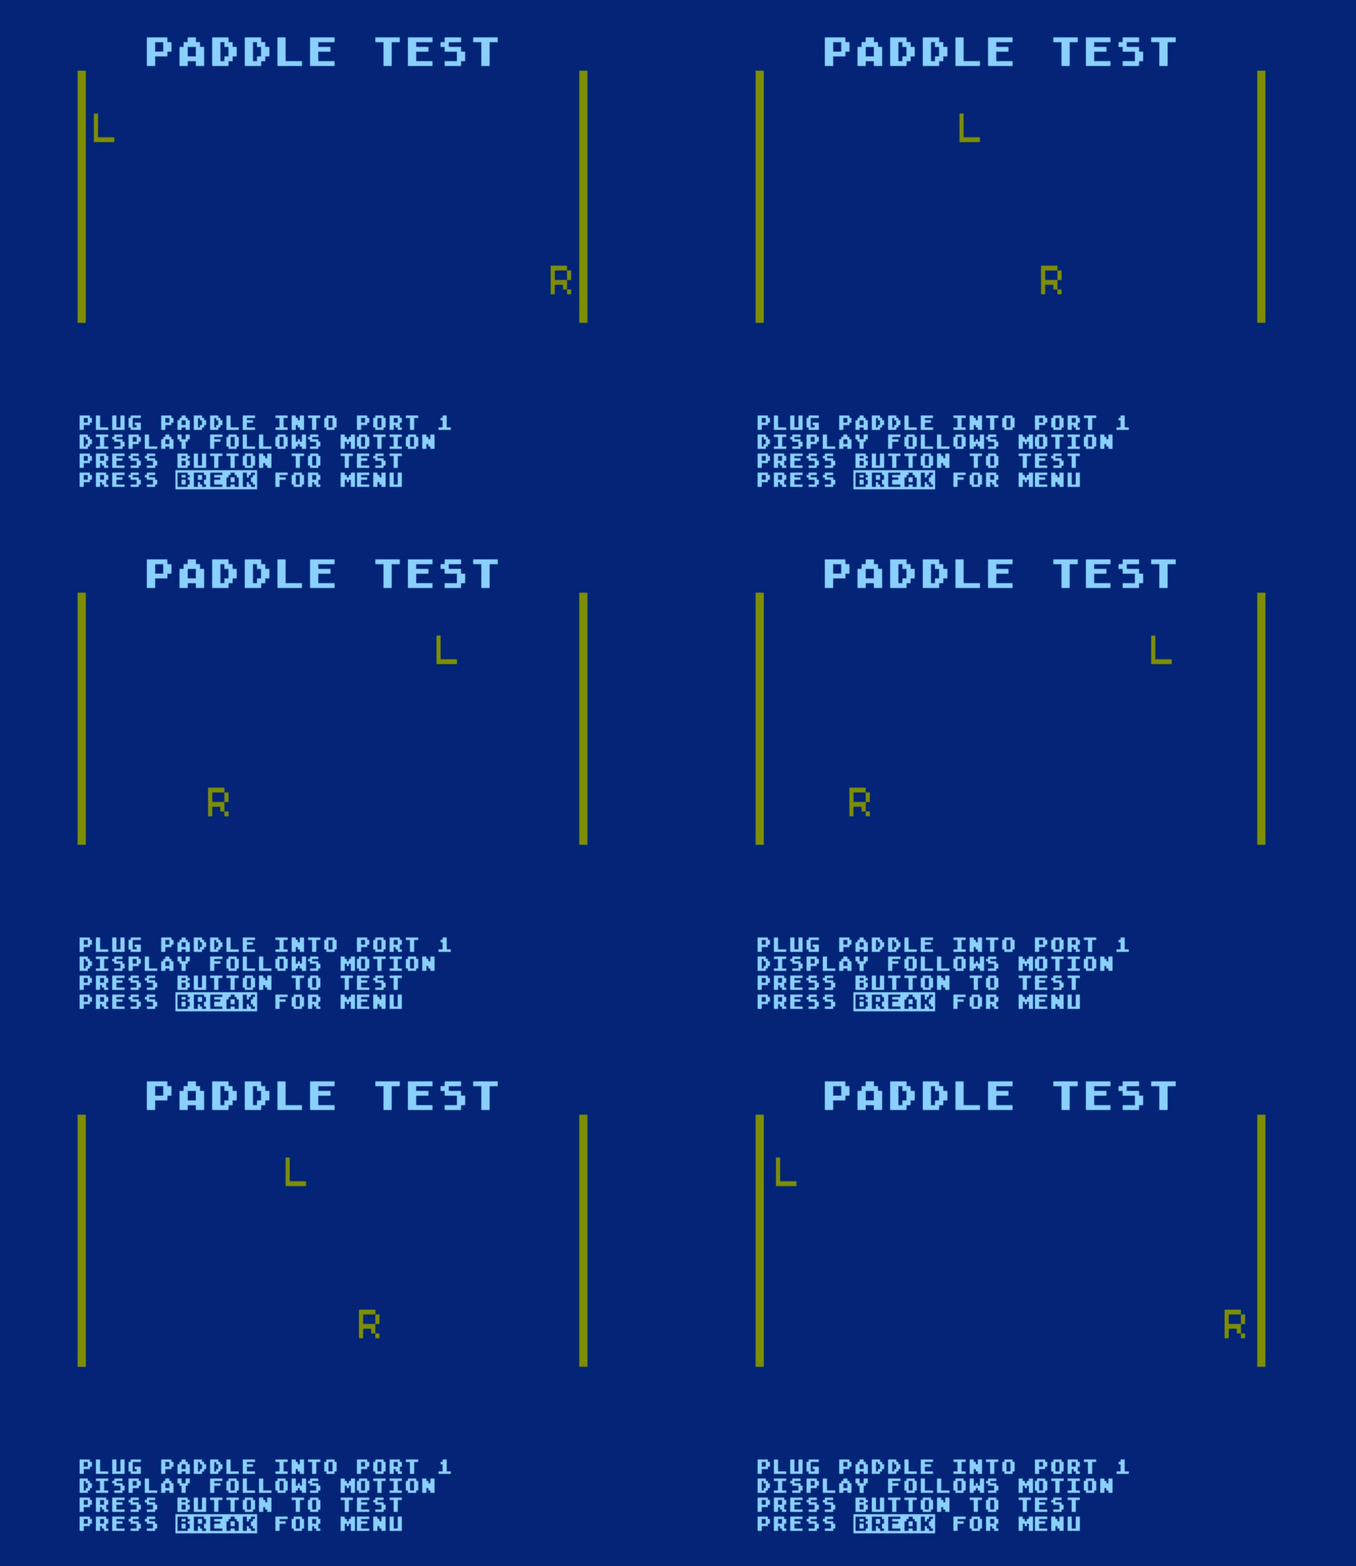
This utility verifies the operation of a paddle controller using a known functional console.
Figure 6-3. Paddle Test
Maintenance Mode
This utility assists in verifying and adjusting the console’s RF modulator alignment. Upon entering Maintenance Mode, a solid black screen is intentionally displayed to facilitate measurement and adjustment of the Channel 2 video carrier frequency (61.25MHz).
Pressing any key enables a continuous audio tone that may be used to verify and adjust the 4.5MHz sound carrier frequency.
Note: Alignment procedures and adjustment points vary between console models. Refer to the appropriate Atari Field Service Manual for the console under test before making RF modulator adjustments.
7. Fatal System Errors
UberSalt rigorously tests and monitors the two lowest pages of RAM for faults during both idle periods and normal operation. If a fault is detected, the system halts and displays a fatal system error code in full-screen format (figure 7.1). Table 7.1 describes the conditions associated with each error code.
Figure 7-1. Fatal System Error Screen
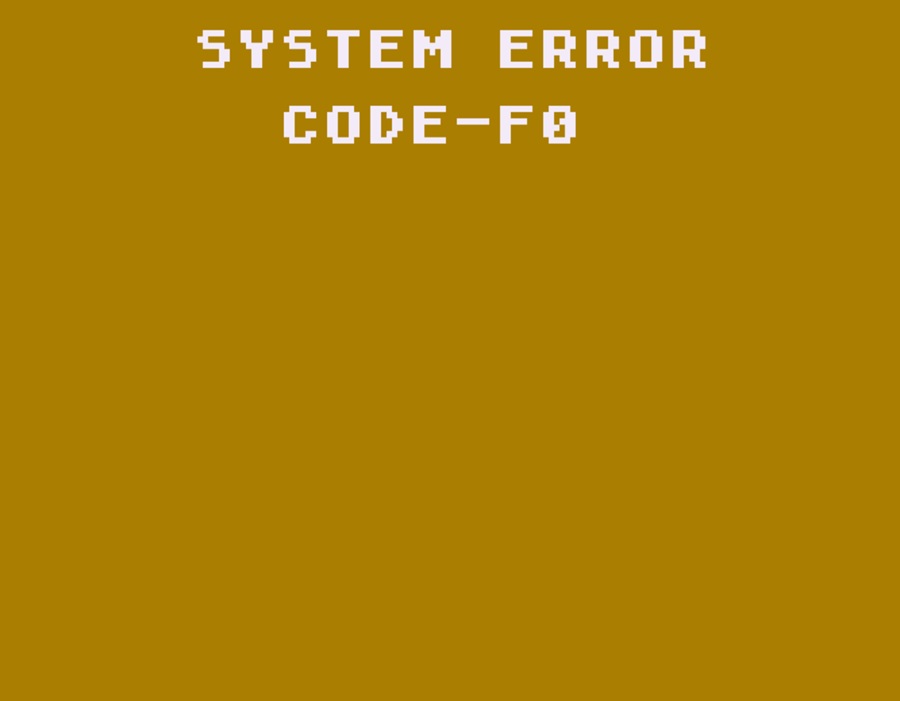
Note: A continuous tone accompanies this screen. Press any console key to silence it.
Table 7-1. Fatal System Errors
| Functional Test (What the system was doing when it happened) | |
|---|---|
| F0 | Failed RAM page 0 refresh test using pattern $FF |
| F1 | Failed RAM address-line test using pattern $00 |
| F2 | Failed RAM address-line test using pattern $FF |
| F3 | Failed RAM page 0 data-line walking-1 test |
| F4 | Failed RAM page 0 refresh test using pattern $00 |
| F5 | Failed RAM test in page 0 or 1 using pattern $00 |
| F6* | Failed RAM page 0 integrity test |
| F7* | Failed RAM page 0 refresh test |
| F8* | Stack/page-1 RAM integrity failure after refresh delay |
| F9 | Serial input failure |
| FA* | Stack underflow – stack pointer exceeded $F8 boundary |
| FB* | Stack overflow – stack pointer crossed below $80 boundary |
| FC* | Stack/page-1 RAM integrity failure |
| * May indicate faulty RAM, address decoding, or CPU operation | |
Note: Fatal system errors often result from corruption of the system RAM used by the diagnostic software. As a result, the fatal error display itself may be incomplete or contain corrupted characters. This effect is more likely when using the enhanced version of the SuperSALT software because it makes more extensive use of page 1 stack RAM during program execution.
8. Error Report Analysis
The Error Report Analysis section supplements the individual test descriptions by explaining how to interpret the diagnostic information reported by the CPS SuperSALT software. Topics include the Error Summary screens, test-specific error reports, and reference data used to analyze diagnostic failures.
8.1 System Error Summary
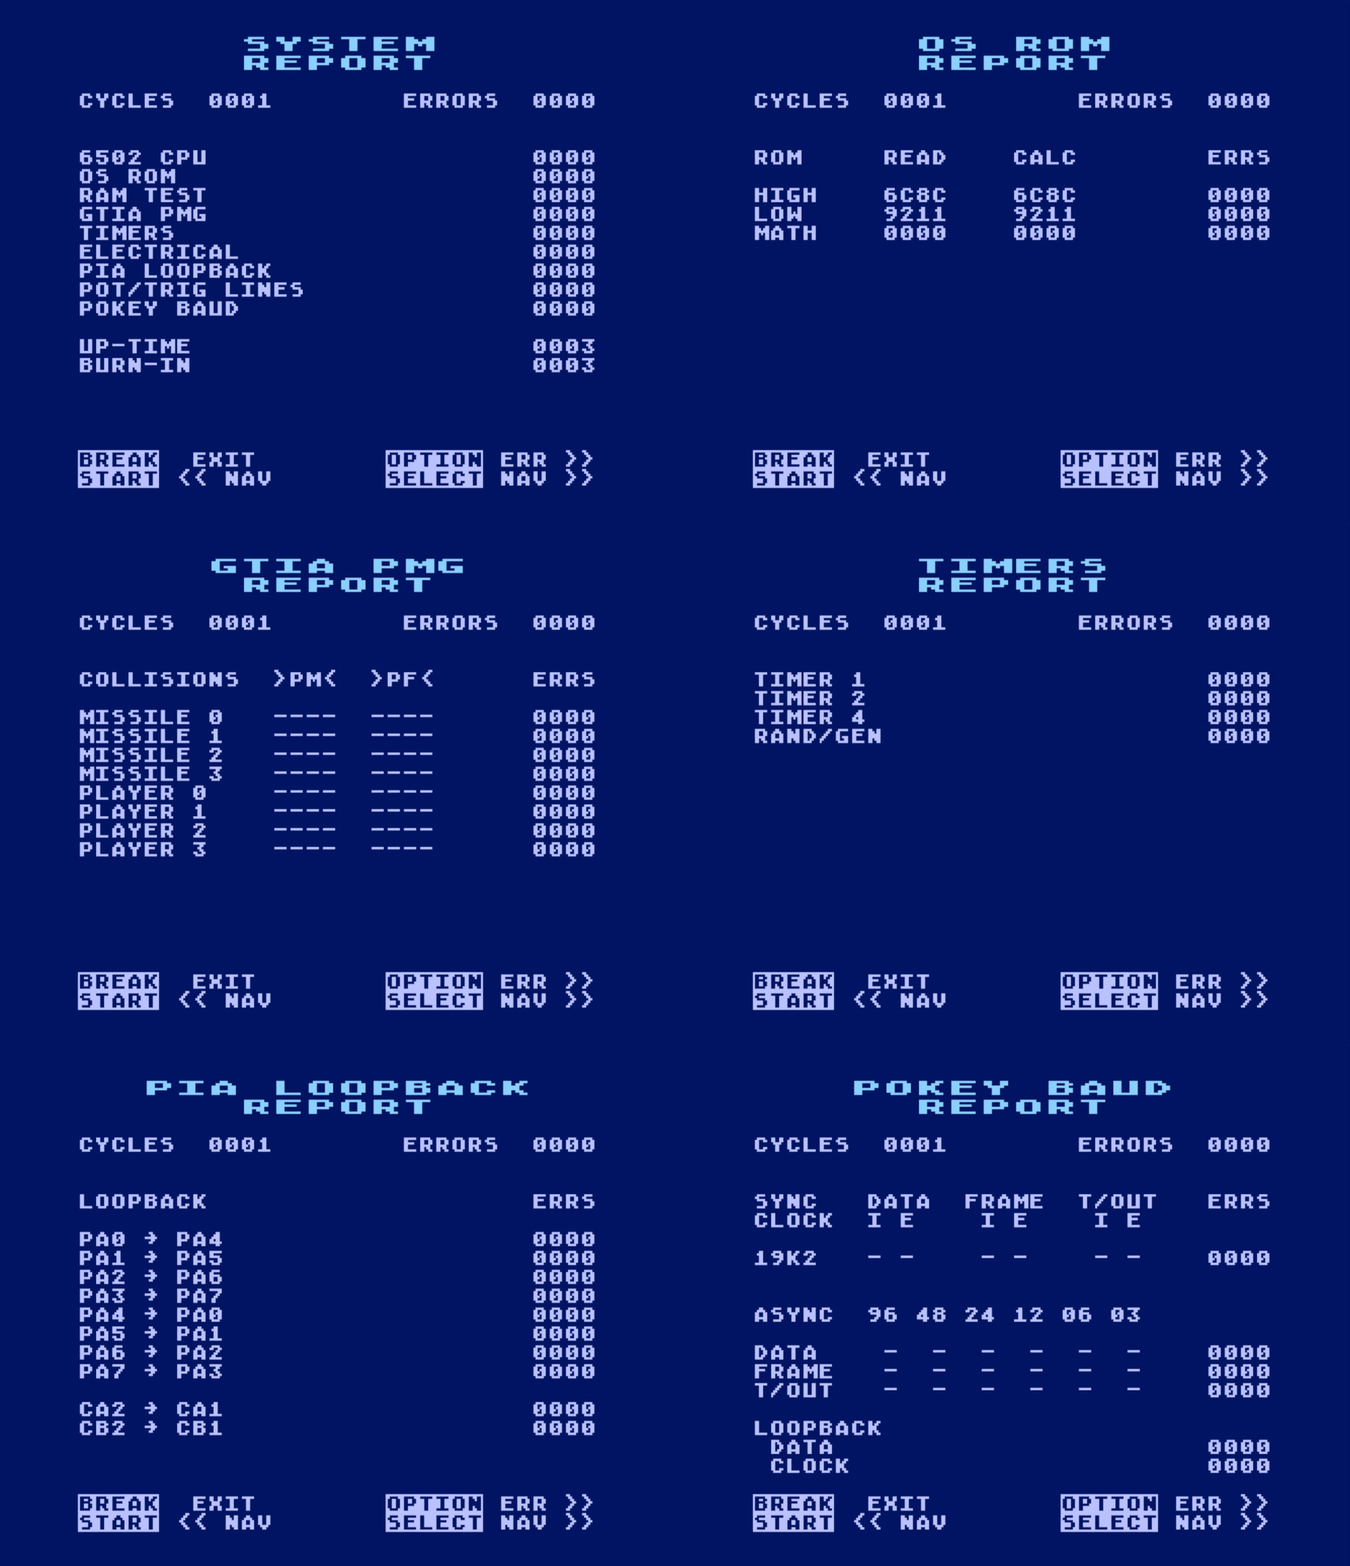
The System Error Summary is the first page of the Error Summary report and provides an overview of the diagnostic session. It displays the total number of completed test sequences and the cumulative number of errors recorded during testing. The remaining Error Summary pages provide a detailed breakdown of the recorded errors by diagnostic category.
Figure 8-1. Error Summary – System
CYCLES
Displays the number of completed test sequences (test groups) performed during Performance Test or Extend Unit Test operation. Each completed test sequence increments this value by one. Diagnostic tests executed individually do not increment the CYCLES count.
ERRORS
Displays the cumulative number of errors recorded during the diagnostic session. This value equals the sum of all errors reported on the eight detailed Error Summary pages that follow.
The next portion of the screen lists the cumulative error counts for each of the remaining eight Error Summary pages. Each entry corresponds to the total errors reported on its respective detail page.
TOTAL RUN TIME
Displays the elapsed time since the CPS SuperSALT software was last initialized. This value is reset whenever the diagnostic software is reinitialized, such as by pressing RESET or powering on the console.
8.2 6502 Error Summary
The 6502 Test verifies the operation of the console’s 6502 microprocessor by executing a comprehensive diagnostic routine that exercises the processor’s complete instruction set. In addition to validating individual instructions, the test verifies addressing modes, register transfers, stack operations, arithmetic and logical operations, branching instructions, and processor status flags.
The 6502 Error Summary reports the cumulative results of the 6502 diagnostic test. The screen consists of the CYCLES and ERRORS fields.
Figure 8-2. Error Summary – 6502
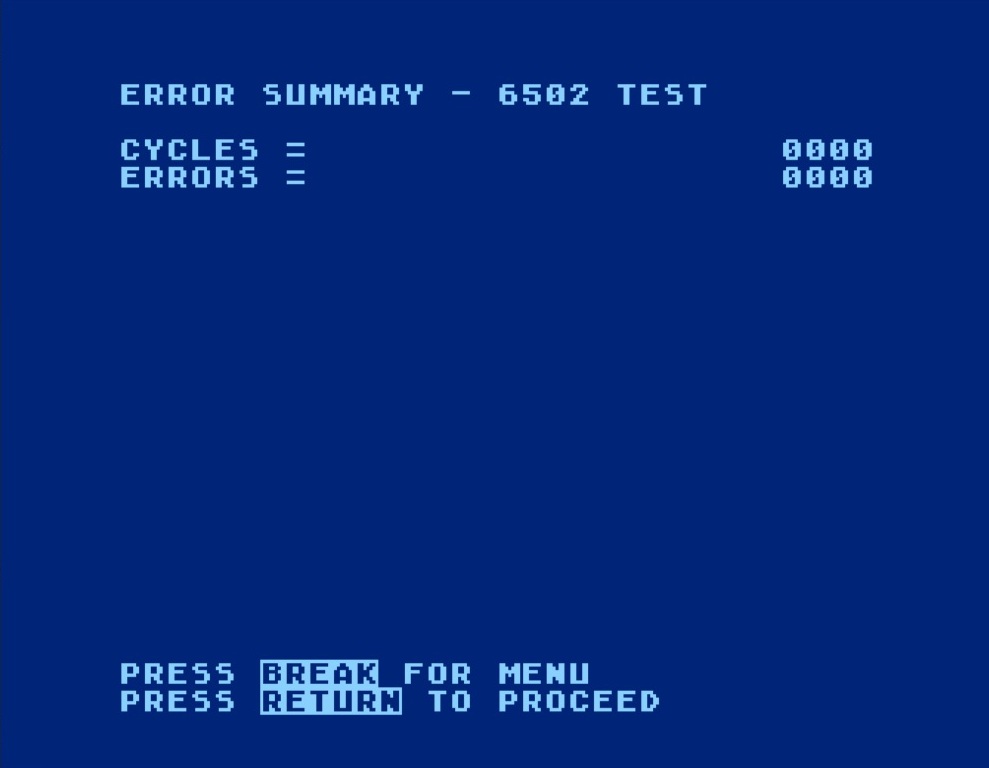
CYCLES
Displays the number of completed 6502 test iterations. Each test iteration consists of 100 executions of the 6502 opcode test and increments the CYCLES value by 100.
ERRORS
Displays the cumulative number of errors recorded during execution of the 6502 diagnostic test.
8.3 OS ROM Error Summary
The OS ROM Error Summary screen (figure 8-3) displays the cumulative results of the OS ROM Checksum Test. In addition to the total number of test executions and checksum failures, the screen displays the calculated and stored checksum values for the most recent test, allowing the operator to identify which ROM failed verification.
Figure 8-3. Error Summary – OS ROM Checksum
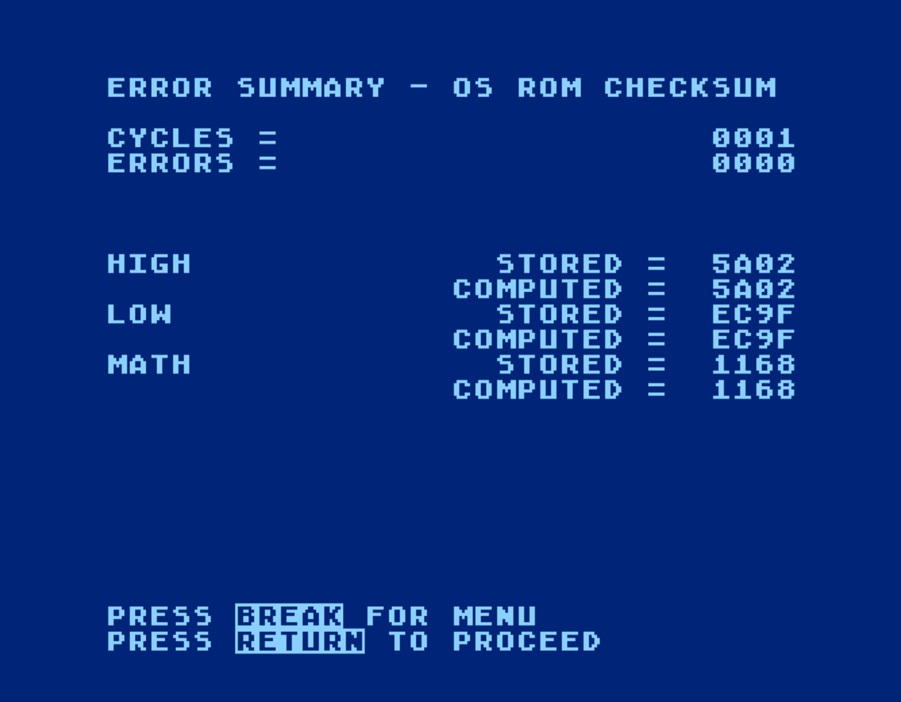
CYCLES
Displays the number of times the OS ROM Checksum test has been executed, whether as part of an automated test sequence or by running the individual test.
ERRORS
Displays the cumulative number of checksum failures detected throughout those test cycles.
The checksum values shown correspond to the most recent execution of the test. For each ROM, CALCULATED is the checksum computed from the ROM contents, while CHECKSUM FOUND is the checksum value stored within the ROM. The two values are compared to verify the integrity of the ROM contents. Discrepancies are recorded as errors.
8.4 RAM Error Summary
The RAM Test performs a series of memory integrity tests using fixed data patterns, pointer-derived data patterns, complemented pointer-derived data patterns, a deterministic pseudo-random data pattern, and a memory-retention check. Each test writes known data to RAM and verifies that the stored values can be read back correctly, allowing the software to detect faulty memory cells, addressing errors, and data-retention failures.
The RAM Error Summary screen, shown in figure 8-4, displays the cumulative results of the RAM Test. While the CYCLES and ERRORS fields accumulate over multiple test executions, the table below identifies the memory locations and data bits that failed during the most recent test.
Figure 8-4. Error Summary – RAM Test
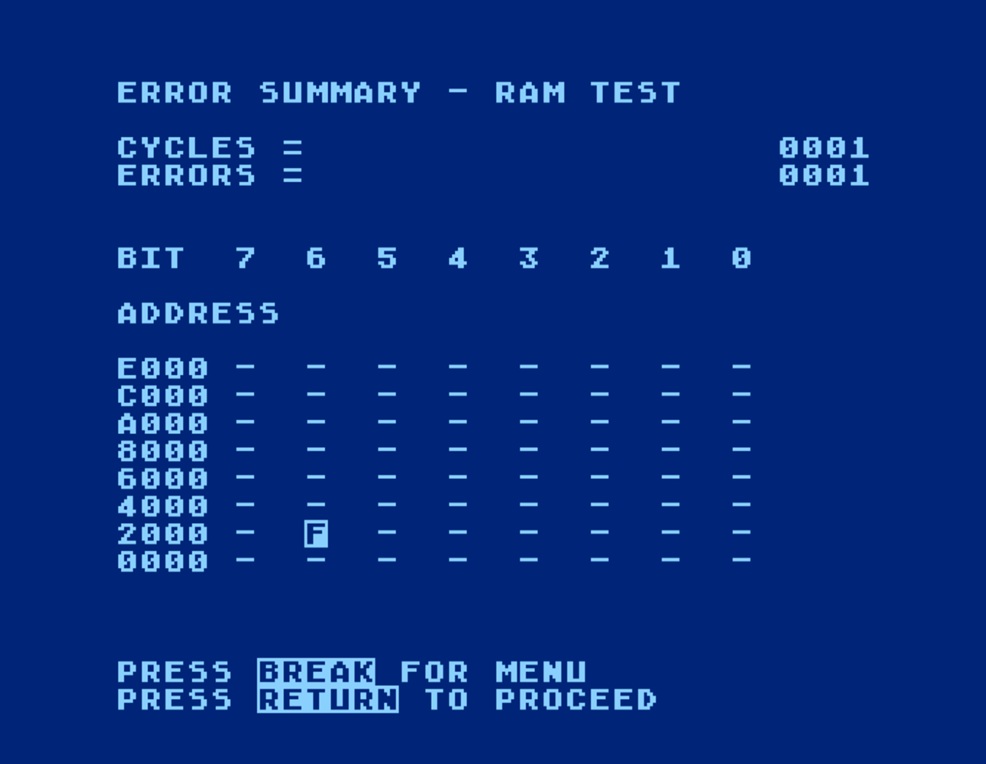
CYCLES
Displays the number of times the RAM Test has been executed, whether as part of an automated test sequence or by running the individual test.
ERRORS
Displays the cumulative number of RAM test failures detected during all test executions.
ADDRESS Table
In the example shown in figure 8-4, the RAM Test has been executed once, resulting in a single detected failure. The failure table indicates that the failure occurred within the 8KB memory bank beginning at address $2000 and involved data bit 6. Each row corresponds to an 8KB memory bank identified by its starting address, while the columns identify data bits 7 through 0. A dash (-) indicates that no failure was detected for the corresponding data bit, while an F indicates that one or more failures involving that data bit were detected somewhere within the corresponding 8KB memory bank.
8.5 GTIA Error Summary
The GTIA Error Summary displays the cumulative results of the GTIA Diagnostics test. The summary provides detailed diagnostic information by summarizing failures detected during the various phases of the test for the GTIA collision registers and trigger inputs.
In the example shown in figure 8-5, the GTIA Exercise has been executed once, resulting in a single detected failure. The ERROR BITS value of C080 reported for Missile 0 identifies collision-register test failures associated with that object. The first two hexadecimal digits represent errors detected during player-to-player or missile-to-player collision testing, while the last two digits represent errors detected during player/missile-to-playfield collision testing. A value of 0000 indicates that no collision errors were recorded.
Figure 8-5. Error Summary – GTIA Exercise Showing Error
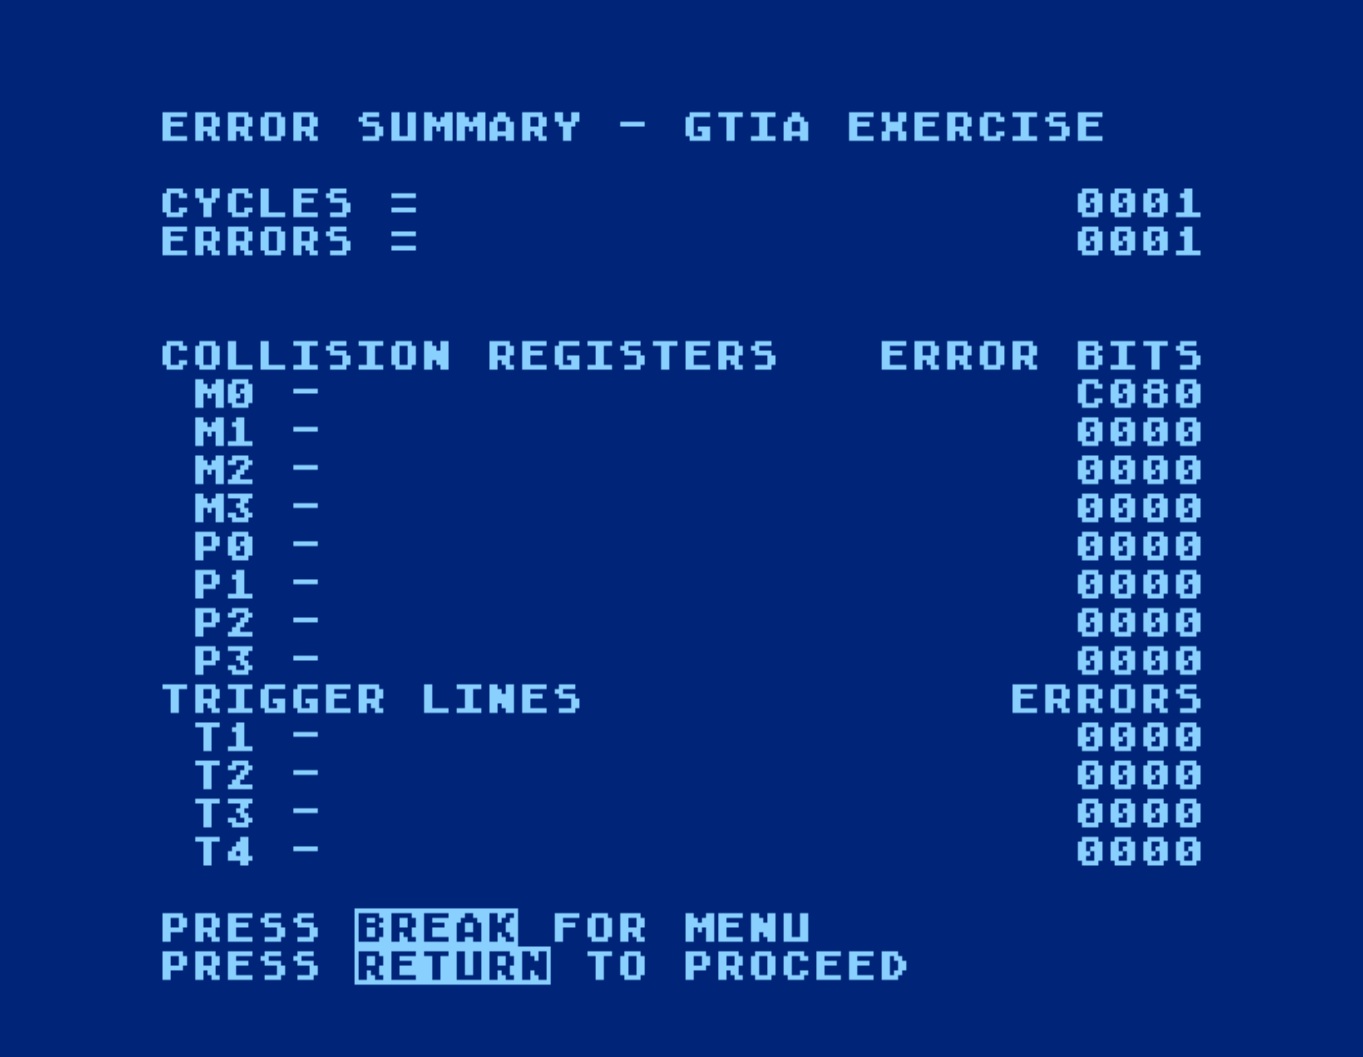
CYCLES
Displays the number of times the GTIA Diagnostics test has been executed, whether as part of an automated test sequence or by running the individual test.
ERRORS
Displays the cumulative number of GTIA Exercise test failures detected during all test executions.
ERROR BITS displays a four-digit hexadecimal bitmask identifying collision-test failures recorded for each player or missile. The first two digits represent errors detected during player-to-player or missile-to-player collision testing, while the last two digits represent errors detected during player/missile-to-playfield collision testing. A value of 0000 indicates that no collision errors were recorded for that entry.
TRIGGER LINE ERRORS display the cumulative number of errors detected for each GTIA trigger input during all GTIA Exercise test executions. A value of 0000 indicates that no trigger line failures were recorded.
8.6 PIA Error Summary
The PIA Error Summary displays the cumulative results of the PIA diagnostics performed during the I/O Port Tests. The summary records failures detected while verifying the PIA data and control line loop-back paths through the port box.
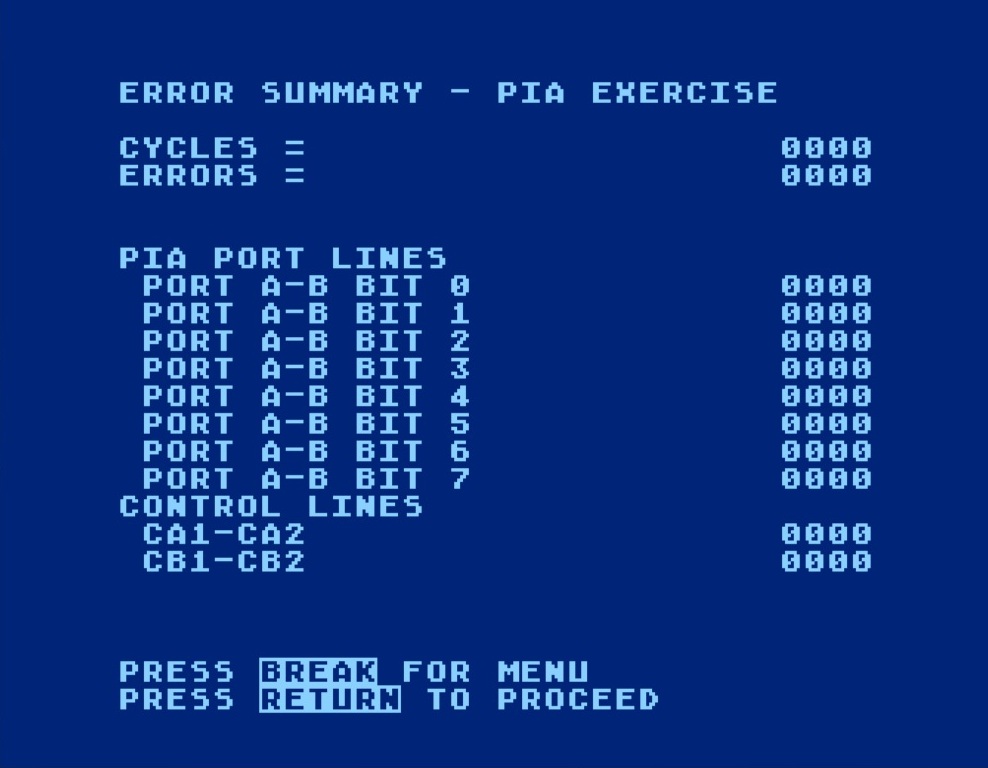
In the example shown in figure 8-6, the I/O Port Tests have been executed ten times, resulting in forty detected failures. The errors reported for PORT A-B BIT 4 through PORT A-B BIT 7 indicate failures detected while verifying the corresponding PIA data-line loop-back paths. The displayed values are cumulative decimal error counts. A value of 0000 indicates that no errors were recorded for the corresponding signal path.
Figure 8-6. Error Summary – PIA Exercise
CYCLES
Displays the number of times the test has been executed as part of the I/O Port Tests.
ERRORS
Displays the cumulative number of failures detected during all PIA diagnostic test executions.
PIA PORT LINES
Each PORT A-B BIT entry represents a data-line loop-back path verified by the test assembly. Errors are recorded against the line being used to drive the test signal.
Table 8-1. PIA Port Loop-back Configuration
| Summary Entry | Atari 400/800 | XL/XE |
|---|---|---|
| PORT A-B BIT 0 | Port A bit 0 ↔ Port B Bit 0 | Port A bit 0 → Port A bit 4 |
| PORT A-B BIT 1 | Port A bit 1 ↔ Port B Bit 1 | Port A bit 1 → Port A bit 5 |
| PORT A-B BIT 2 | Port A bit 2 ↔ Port B Bit 2 | Port A bit 2 → Port A bit 6 |
| PORT A-B BIT 3 | Port A bit 3 ↔ Port B Bit 3 | Port A bit 3 → Port A bit 7 |
| PORT A-B BIT 4 | Port A bit 4 ↔ Port B Bit 4 | Port A bit 4 → Port A bit 0 |
| PORT A-B BIT 5 | Port A bit 5 ↔ Port B Bit 5 | Port A bit 5 → Port A bit 1 |
| PORT A-B BIT 6 | Port A bit 6 ↔ Port B Bit 6 | Port A bit 6 → Port A bit 2 |
| PORT A-B BIT 7 | Port A bit 7 ↔ Port B Bit 7 | Port A bit 7 → Port A bit 3 |
CONTROL LINES
During each test, a control signal generated by the PIA exits through the SIO interface, is looped back by the test assembly, and returns to the corresponding PIA input. Specifically, CA2 drives the MOTOR CONTROL output, which is looped back to the PROCEED input (CA1). Likewise, CB2 drives the COMMAND output, which is looped back to the INTERRUPT input (CB1).
8.7 POKEY Error Summary
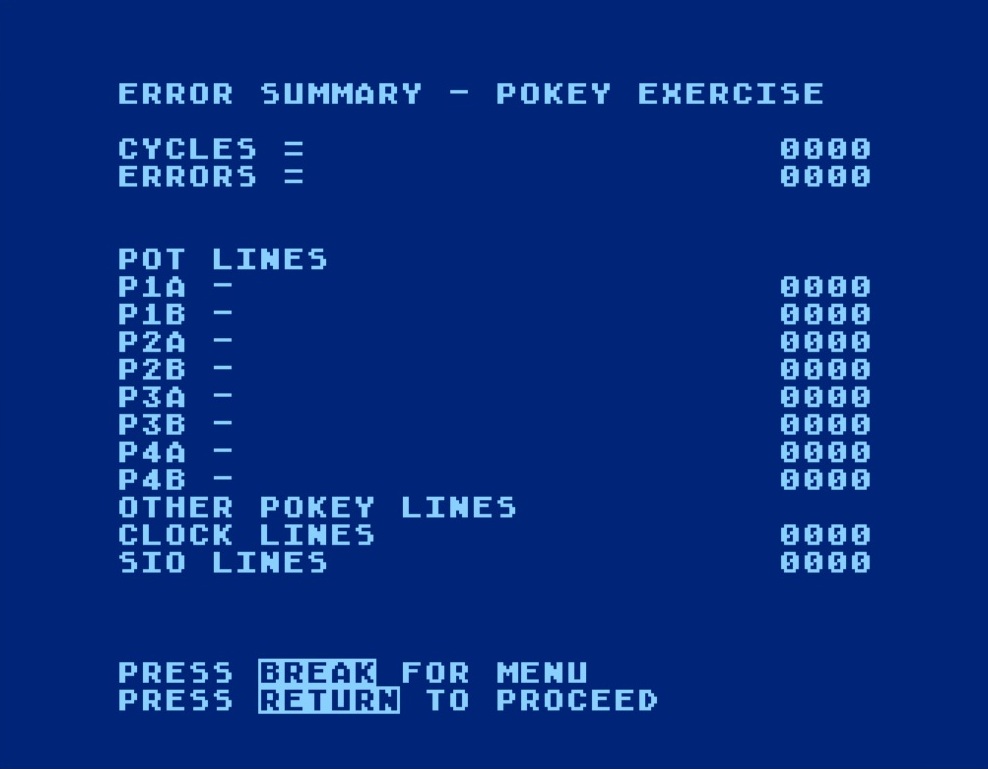
The POKEY Error Summary displays the cumulative results of the POKEY diagnostics performed during the I/O Port Tests. The summary records failures detected while testing the POKEY potentiometer inputs, serial interface signals, and clock interface signals.
Figure 8-7. POKEY Exercise
CYCLES
Displays the number of times the POKEY diagnostics have been executed as part of the I/O Port Tests.
ERRORS
Displays the cumulative number of failures detected during all POKEY diagnostic test executions. In this case, a single error was detected. Refer to the POT LINES table for details.
POT LINES
Each POT LINES entry corresponds to one of the eight POKEY potentiometer inputs. The designations P1A through P4B identify Controller Ports 1 through 4 and their associated A and B potentiometer inputs. A blank entry indicates that no failures were detected. Reported error codes are interpreted as follows:
- A Possible short to +5V.
- B Measured time constant is longer than expected.
- D Measured time constant is shorter than expected.
- E Both A and D conditions were detected.
CLOCK LINES
Displays the cumulative number of failures detected while verifying the serial clock interface during execution of the I/O Port Tests.
SIO LINES
Displays the cumulative number of failures detected while verifying the serial data and control signal interface during execution of the I/O Port Tests.
8.8 Timers Error Summary
intro figure 8-8
Figure 8-8. Timers/Random Number Generation
CYCLES
ERRORS
8.9 Baud Error Summary
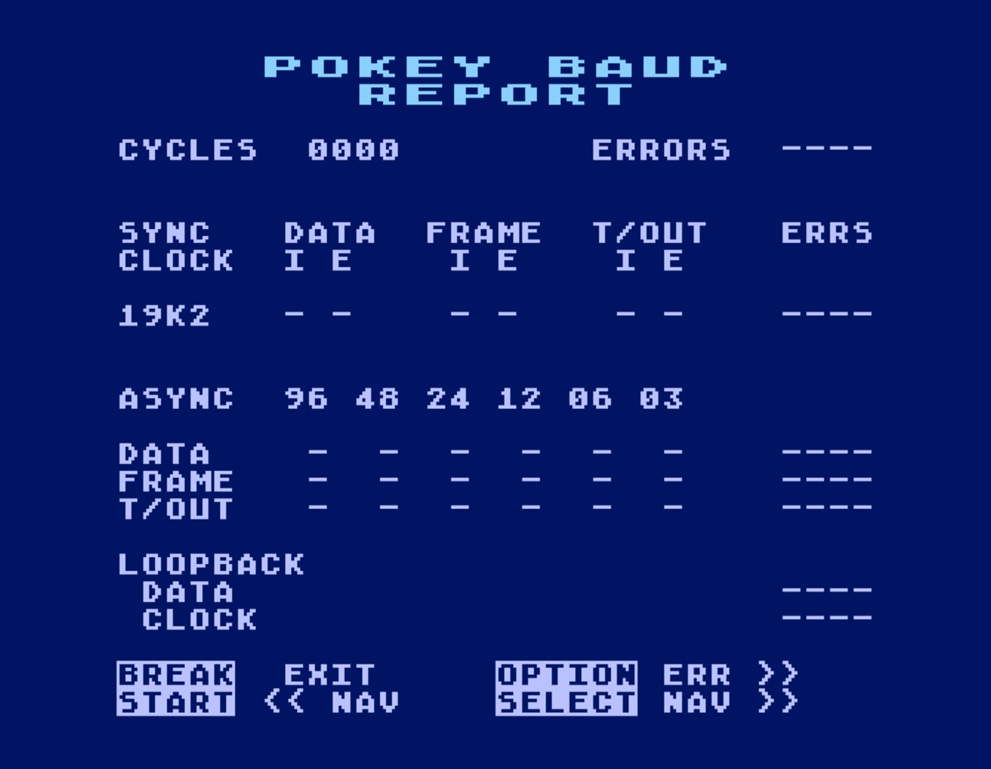
intro figure 8-9
Figure 8-9. Error Summary – Baud Rate
CYCLES
ERRORS
Baud Rate Report
The following tables provide a reference for interpreting baud rate error code information reported by the Error Summary. Together, they define the error types, error codes, and corresponding baud rates used to identify serial communication failures.
The Error Type values indicate the number of failures detected in each baud rate test category. The Error Code values are not error counts. Instead, they are 8-bit diagnostic codes displayed as two hexadecimal digits with leading zeros. Each bit represents one or more specific failure conditions that can be decoded using the following tables.
Table 8-2. SYNC 19.2K Error Bit Assignments
Bit 7 | Bit 6 | Bit 5 | Bit 4 | Bit 3 | Bit 2 | Bit 1 | Bit 0 |
|---|---|---|---|---|---|---|---|
| – | Data Error | Framing Error | Timeout | – | |||
| – | INT CLK | EXT CLK | INT CLK | EXT CLK | INT CLK | EXT CLK | – |
Table 8-3. ASYNC Baud Rate Bit Assignments
| Bit 7 | Bit 6 | Bit 5 | Bit 4 | Bit 3 | Bit 2 | Bit 1 | Bit 0 |
|---|---|---|---|---|---|---|---|
| – | 9600 | 4800 | 2400 | 1200 | 600 | 300 | – |